More People: The Worst Decade in South Bend History

This is the introduction to an article and podcast series by Joe Molnar titled More People: How South Bend Lost 50,000 People in 50 Years. Joe is a proud 4th generation son of South Bend.
Read the original series: Introduction | One | Two | Three | Four | Five | Six | Seven
Read the census recap: Introduction | One | Two
Subscribe to the podcast: Apple | Spotify | Google | Stitcher | TuneIn
“Those who need government services the most – the poor, the elderly, those lacking job skills – will continue living in our city. Those who can afford to take care of themselves, provide the services and provide the tax base to support municipal services will continue moving out of the city. That must stop. It’s the big problem we face in the next decade.”
– Mayor Lloyd M. Allen, January 1972¹
• • •
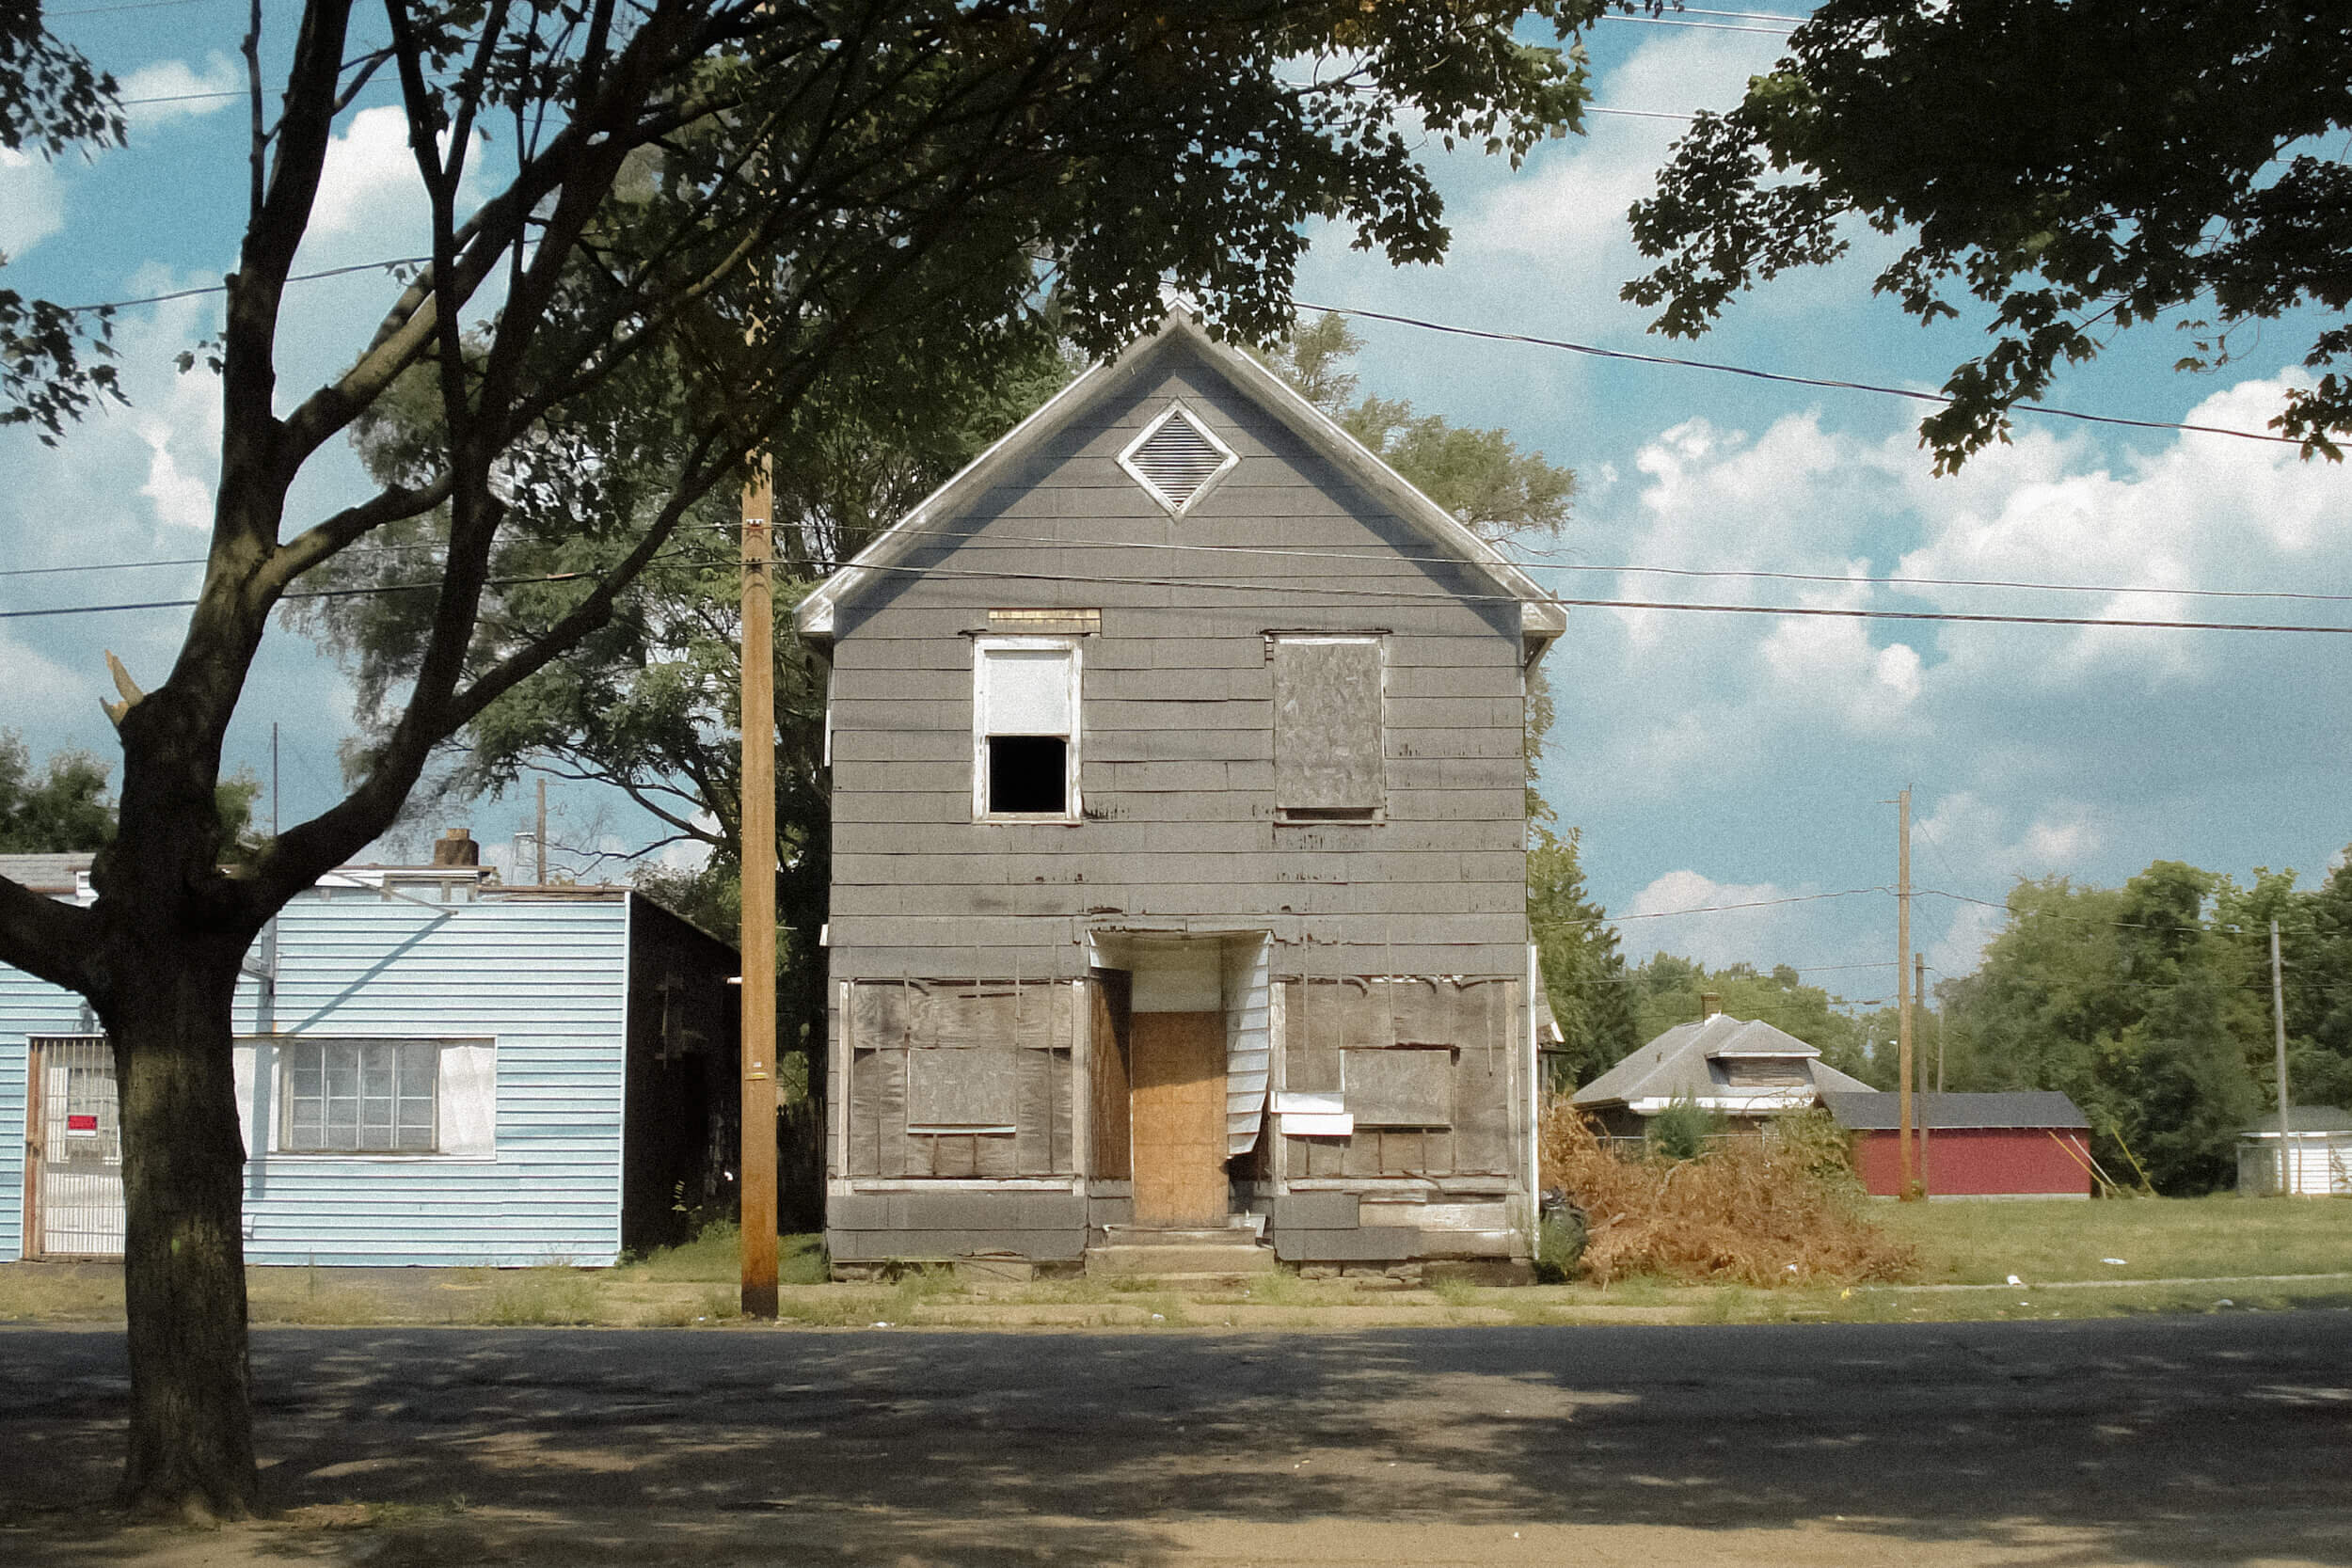
Growing up in South Bend during the 1990s and early 2000s, I always had the feeling that the collapse had come and gone, and that the city was now just finding its footing in a post-Studebaker world.² South Bend was a nice place to live, but all around there were reminders that the city once looked a good deal different (bigger and better). Factories dotted the landscape of every older neighborhood, but they were all long since abandoned. Be it the Ward Bakery building in the Near Northwest Neighborhood, Drewrys Brewery further northwest, or the hulking mass of long quiet Studebaker factories just south of downtown, children during this time grew up in the ruins of a past long gone.
By the mid-90s, downtown had long relinquished its role as the primary shopping destination for the region. We tore down beautiful buildings and replaced them with half-empty parking lots. There was a very real sense – at least to me – that South Bend was a place which only existed because it used to matter. We hung on because we once served a purpose for the world. But that purpose was long gone.
Looking back however – despite that feeling I had as a child – the neighborhoods dotted by vacant factories were still largely intact. For me, in the early 2000s it was commonplace to ride your bike throughout the west and southeast portions of the city in neighborhoods still fully occupied with only the occasional vacant lot or house. As this article will attempt to show, the dramatic problem of depopulation and abandoned housing was more a consequence of the 2000s than the decline in household size during the 1900s.
I say this for others to understand that I am under no illusion of the difficulties South Bend faced during those decades. However difficult the second half of the 20th century was for the City of South Bend, which I’ll not deny, I’m still convinced the first decade of the 21st was far worse. There are few flashy events like the closing of Studebaker in December 1964, Drewrys in November 1972, or Urban Renewal hollowing out downtown, but the loss of population in the 2000s was a completely new and unique type of decline for South Bend. This different type of decline is demonstrated through analyzing the collapse of households, doubling of vacant housing, and a 40% increase in the number of residents below the poverty line. While many of these problems had been issues for some time, their severity and breadth exploded during the 2000s.
Let’s break this down to the basics, imagine there is a town – a town so small we’re going to name it Tiny Town – with just one residential road. On this road sits 10 houses in which 35 people call home. This is year one. By year two, even with all 10 houses still occupied, only 25 people call Tiny Town home. By year three, two of the homes have been abandoned with one torn down, our little town now has just 20 people. It’s been a bad two years for Tiny Town no matter which view you take, but which year was worse? Was it year two, where the town lost 10 people? Or year three, when the town lost “just” five people?
Most would argue that year two was clearly the worst year. The town lost 10 people, nearly 30% of its population! The numbers are bigger! I disagree. In year three, Tiny Town lost five people – another 20% drop – but, more importantly, two households disappeared. A vacant lot remains behind where a home once stood, and the entire town is worse for its loss. Taxes are increased on the remaining eight households to make up for the lost revenue (someone must pay for the one part-time employee).
South Bend is Tiny Town. From 1960 through 2010, it lost approximately 32,000 people and more than 1,000 households. However, the decline was not uniform from decade to decade. Just like Tiny Town, there are two distinct phases of decline. From 1960 to 2000, the city lost around 25,000 people, but the number of households increased over that period. From 2000 to 2010, the city lost about 6,000 people and, more ominously, over 3,000 households. This was the first time in South Bend’s history the number of households declined. Not during the Great Depression, nor after the collapse of Studebaker and other local industrial giants, had the city failed to add households like it did in the 2000s.
In the previous article, I broke up South Bend’s population history since 1940 into four distinct stages:
Rapid household growth: 1940 – 1960
Minimal household growth: 1960 – 1990
Stabilization: 1990 – 2000
Collapse: 2000 – 2010
We ended that article in the year 2000 with South Bend on the upswing. During the 1990s, South Bend grew by 2,000 people, resulting in the first population growth since the 1950s, around 650 new households, and a decrease in the number of vacant addresses. By nearly all measures available, the demographic decline South Bend suffered from 1960 through 1990 had ended. Sadly, the decline did not end in 1990 and was renewed with painful vigor in the 2000s.
Household and population decline
I apologize for the sheer number of statistics cited in this piece, but I think it’s important to illustrate in detail how detrimental the 2000s were for South Bend. Already indicated above, the number of households in South Bend fell during the 2000s, but this statistic is worth repeating. Despite the population decline from 1960 to 1990, South Bend always gained households. The primary driver of population decline was simply households were smaller than before. But in the 2000s, South Bend lost population because households left.
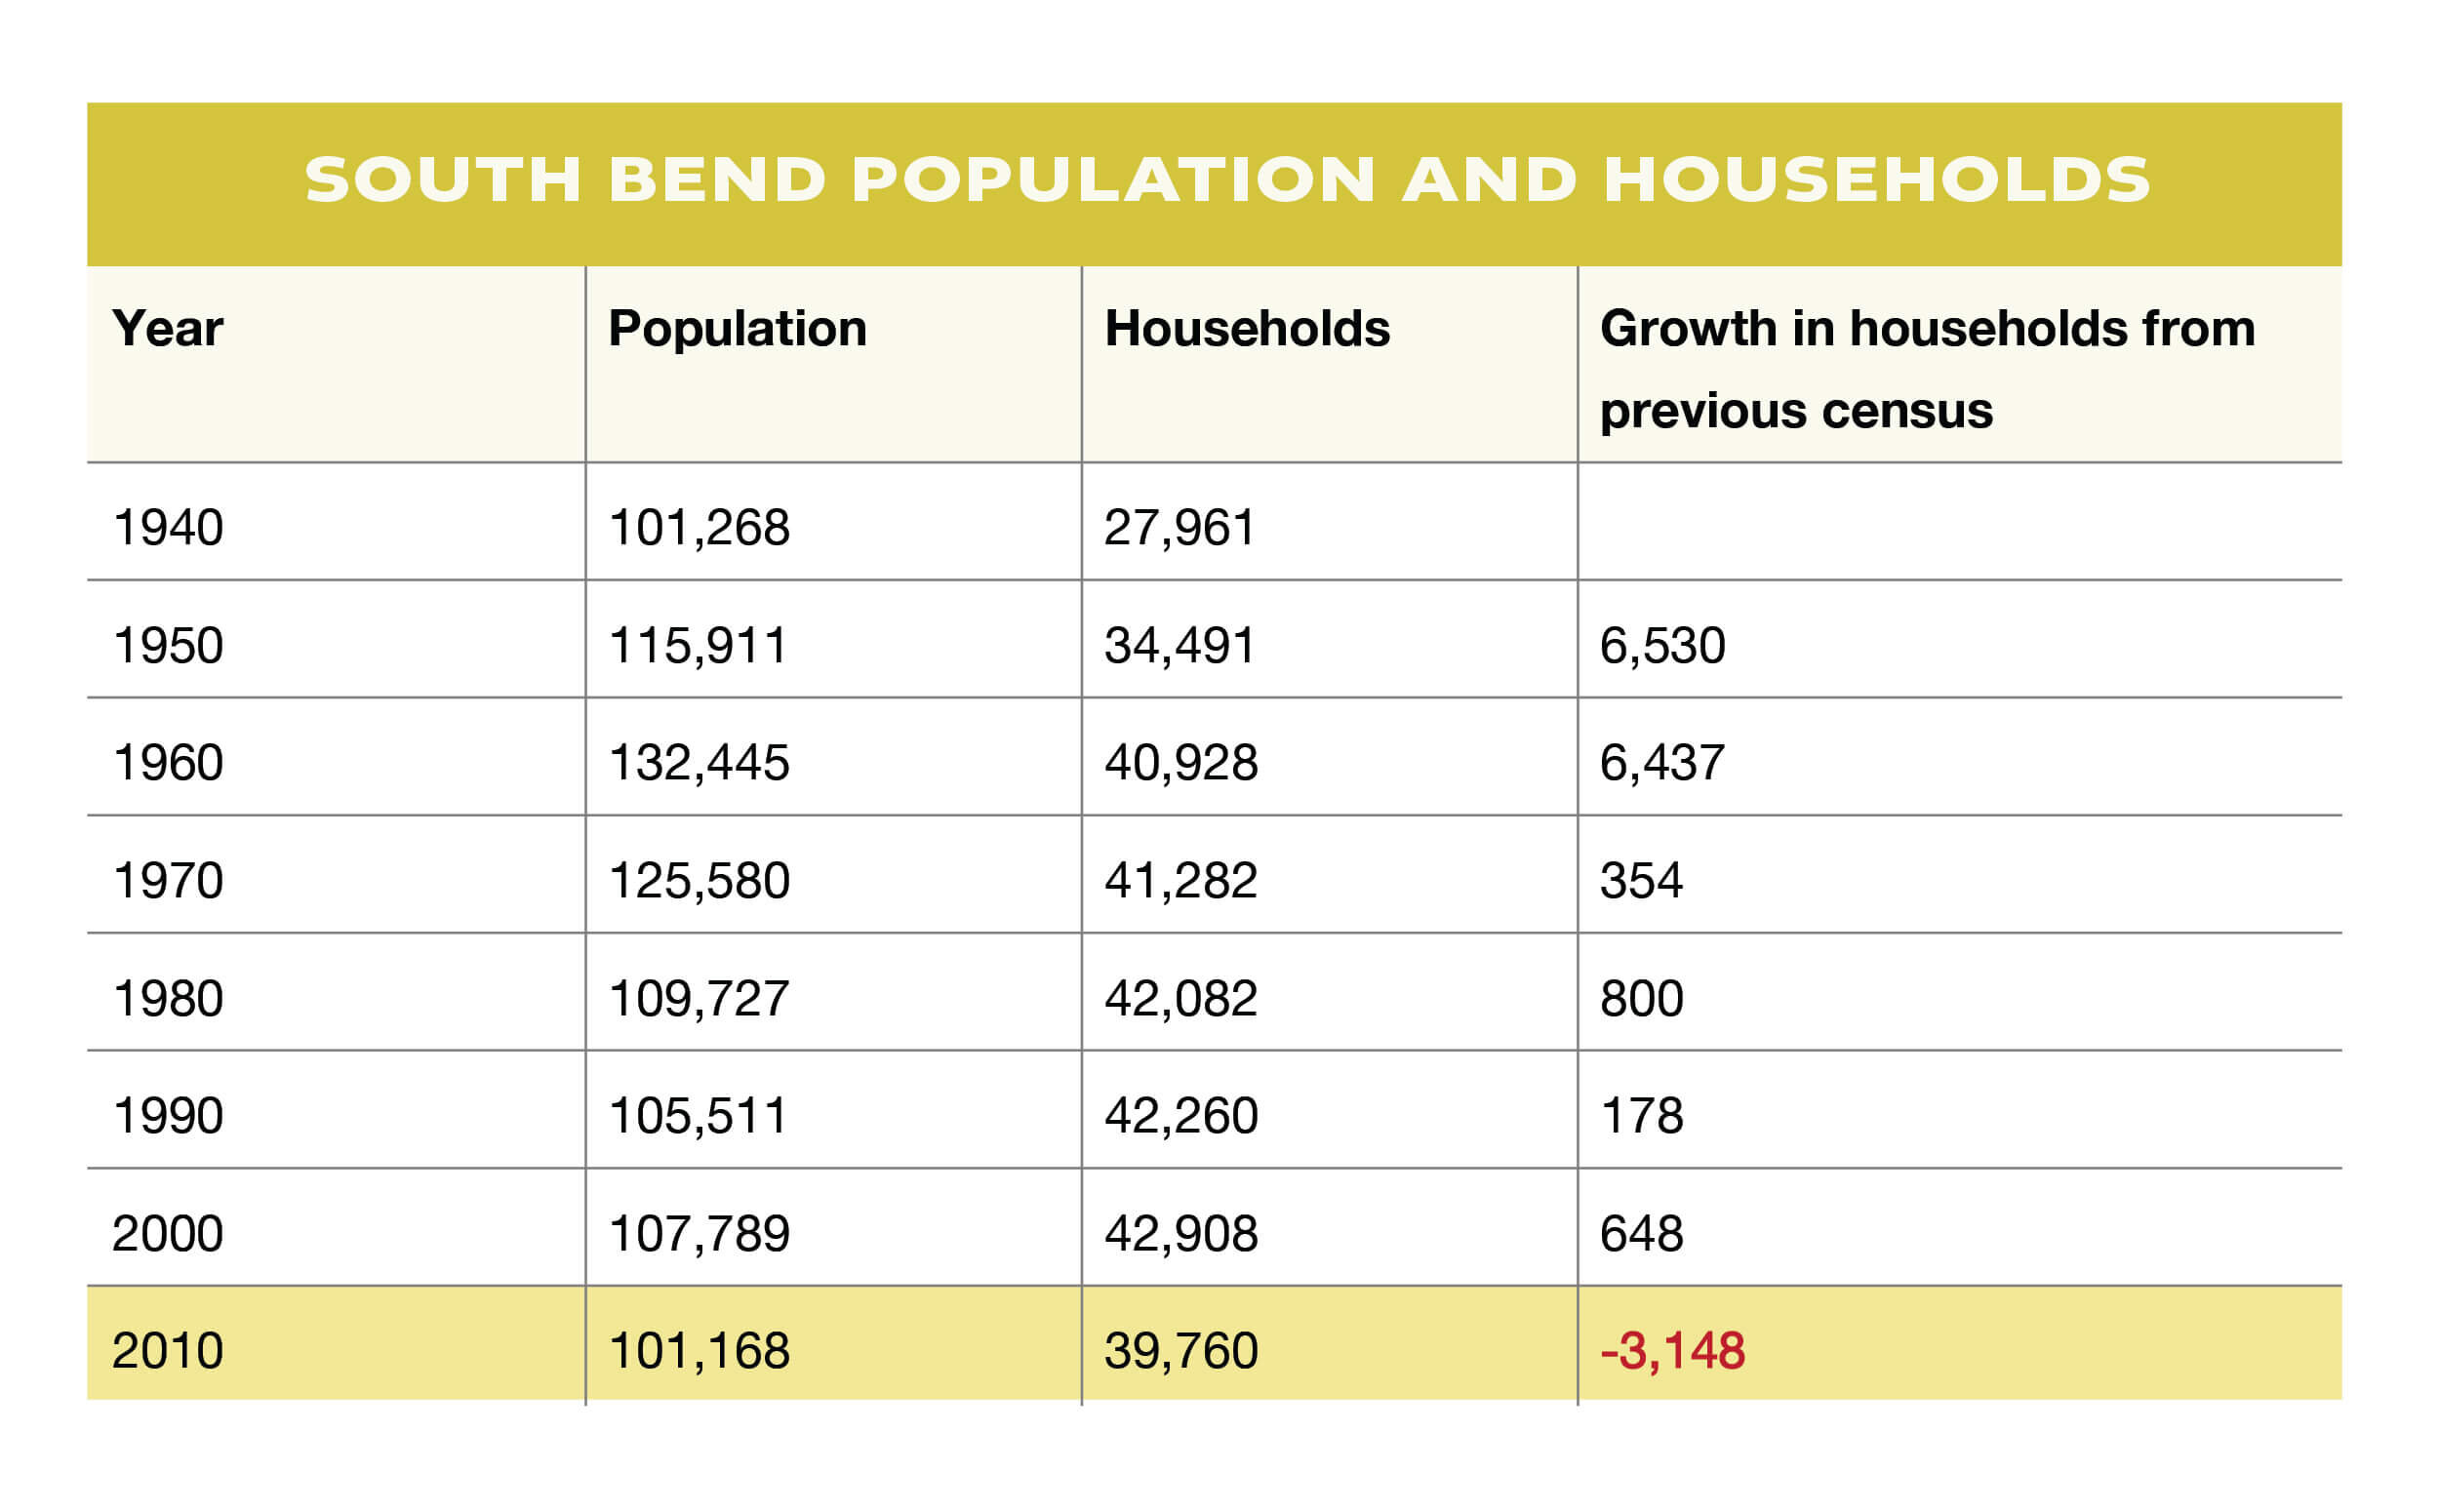
South Bend lost an unprecedented 7.5% of its households in just one decade. Why did this happen? A large portion of the blame can be leveled at the United States Housing Bubble which burst in 2006. Throughout the 1990s and early 2000s, housing prices across the country, including in South Bend, started to rise. This was primarily due to speculation accompanied by relaxed standards for mortgage loans, low interest mortgage rates, and low short-term interest rates sometimes referred to as Adjustable Rate Mortgages (low interest rates at the beginning of a loan, which then rise as the mortgage ages). These poor practices increased the opportunity for housing price speculation, prices rose quickly across all sectors of the housing markets. Buyers were given loans they could not feasibly pay off on homes not worth what they were purchased for.
When the bubble burst across the country and housing prices fell, homeowners found themselves paying mortgages greater than the value of their homes. Homeowners – and landlords as well – were unable to refinance or sell their property given the gap between its value and what they owed on their mortgages. This trapped many people in mortgages they could not afford – made worse as unemployment rose and wages stagnated – and, when they couldn’t make the payments on the mortgage, lending institutions began the foreclosure process and evicted the homeowners. Foreclosed homes returned to the housing markets, which further pushed home prices into a downward spiral.³
While this is a complicated problem because of its national cause and scope, let’s focus on a hypothetical at the very basic South Bend level. In 2004, a young woman purchased her first home. It’s a 1,200-square-foot, two-story, traditional foursquare in the Near Northwest Neighborhood, with three bedrooms, one bathroom, and a detached garage accessed off the alley. South Bend built this type of housing unit rapidly during the early 20th century to keep up with growing demand. The house is old, outdated, and lacks many amenities new homebuyers were looking for in the mid-2000s. However, it has certain “character” that many people claim they wish for in a house – a built in bookshelf, fireplace with authentic mantel, etc. – and most importantly its affordable for first time homebuyers. This specific house has never been a rental property and has been relatively well maintained for its one-hundred-year existence.
Our young first-time buyer purchased the house for $56,000 and made monthly mortgage payments of just under $500 a month, which include property taxes, mortage insurance, and homeowner’s insurance. This is a manageable monthly payment for someone making just over $30,000 as a recently graduated paralegal with a local law firm. However, the bank would only give her the loan if she agreed to an Adjustable Rate Mortgage (ARM) since she could only provide 5% down during the purchase of the home. Her mortgage started with a low interest rate of 4%, but would rise 0.5% every year until it reached the end rate of 7% interest.
By 2007, the housing market officially crashed in South Bend, along with the rest of the nation. Homes of similar quality and style to our hypothetical home sat on the market for months before eventually selling for as low as $20,000 a year. In 2007, our first-time buyer is still employed and, although her monthly mortgage payment has risen to $540 a month (due to the ARM), her payments are still manageable even though she owes more on her house than its market value is now worth.
In mid-2008, as the country starts down the Great Recession, her employer downsizes and lays off our first-time home buyer. With the South Bend unemployment rate at 8% and rising – eventually plateauing around 12% from 2009 through 20114 – the chance of finding a well-paying job is poor. Our first-time homebuyer can no longer pay her monthly mortgage payments and is forced to move back in with her parents. She can’t sell the home because no one is offering more than $25,000 for her house on which she still owes $50,000. Her bank forecloses on the property, takes the home, and the house sits empty for years before deteriorating to the point where the city tears it down in the early 2010s.
In just a few years, this house, which had served as a home and vital part of a stable neighborhood for over a century, has succumbed to the pressure of the global housing crisis. Thousands of versions of this story – many times including purchases made by out-of-town Limited Liability Corporations (LLC) who have no intention of maintaining their properties – happened throughout South Bend from 2007 to 2010. Many times, the houses were eventually purchased, rehabbed, and returned to the market. Far too often, however, that never happened.
In 2013, the city produced a Vacant and Abandoned Properties Task Force Report, which attempted to put into context what happened to the city and how to move forward. The report produced data vital to understanding how and why the increase of vacant properties occurred. In just six years, from 2001 to 2007, there were 6,777 foreclosures in South Bend.⁵ To put that into perspective, there were roughly 43,000 households at the start of the 2000s and, in the seven-year period indicated above, roughly 15% of households in South Bend experienced a foreclosure (although some homes may have been foreclosed on more than once)
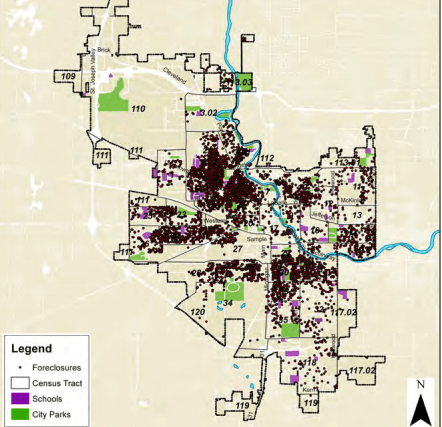
Foreclosures occurring in South Bend from 2001-2007, Vacant & Abandoned Properties Task Force Report 2013
Vacant properties rise
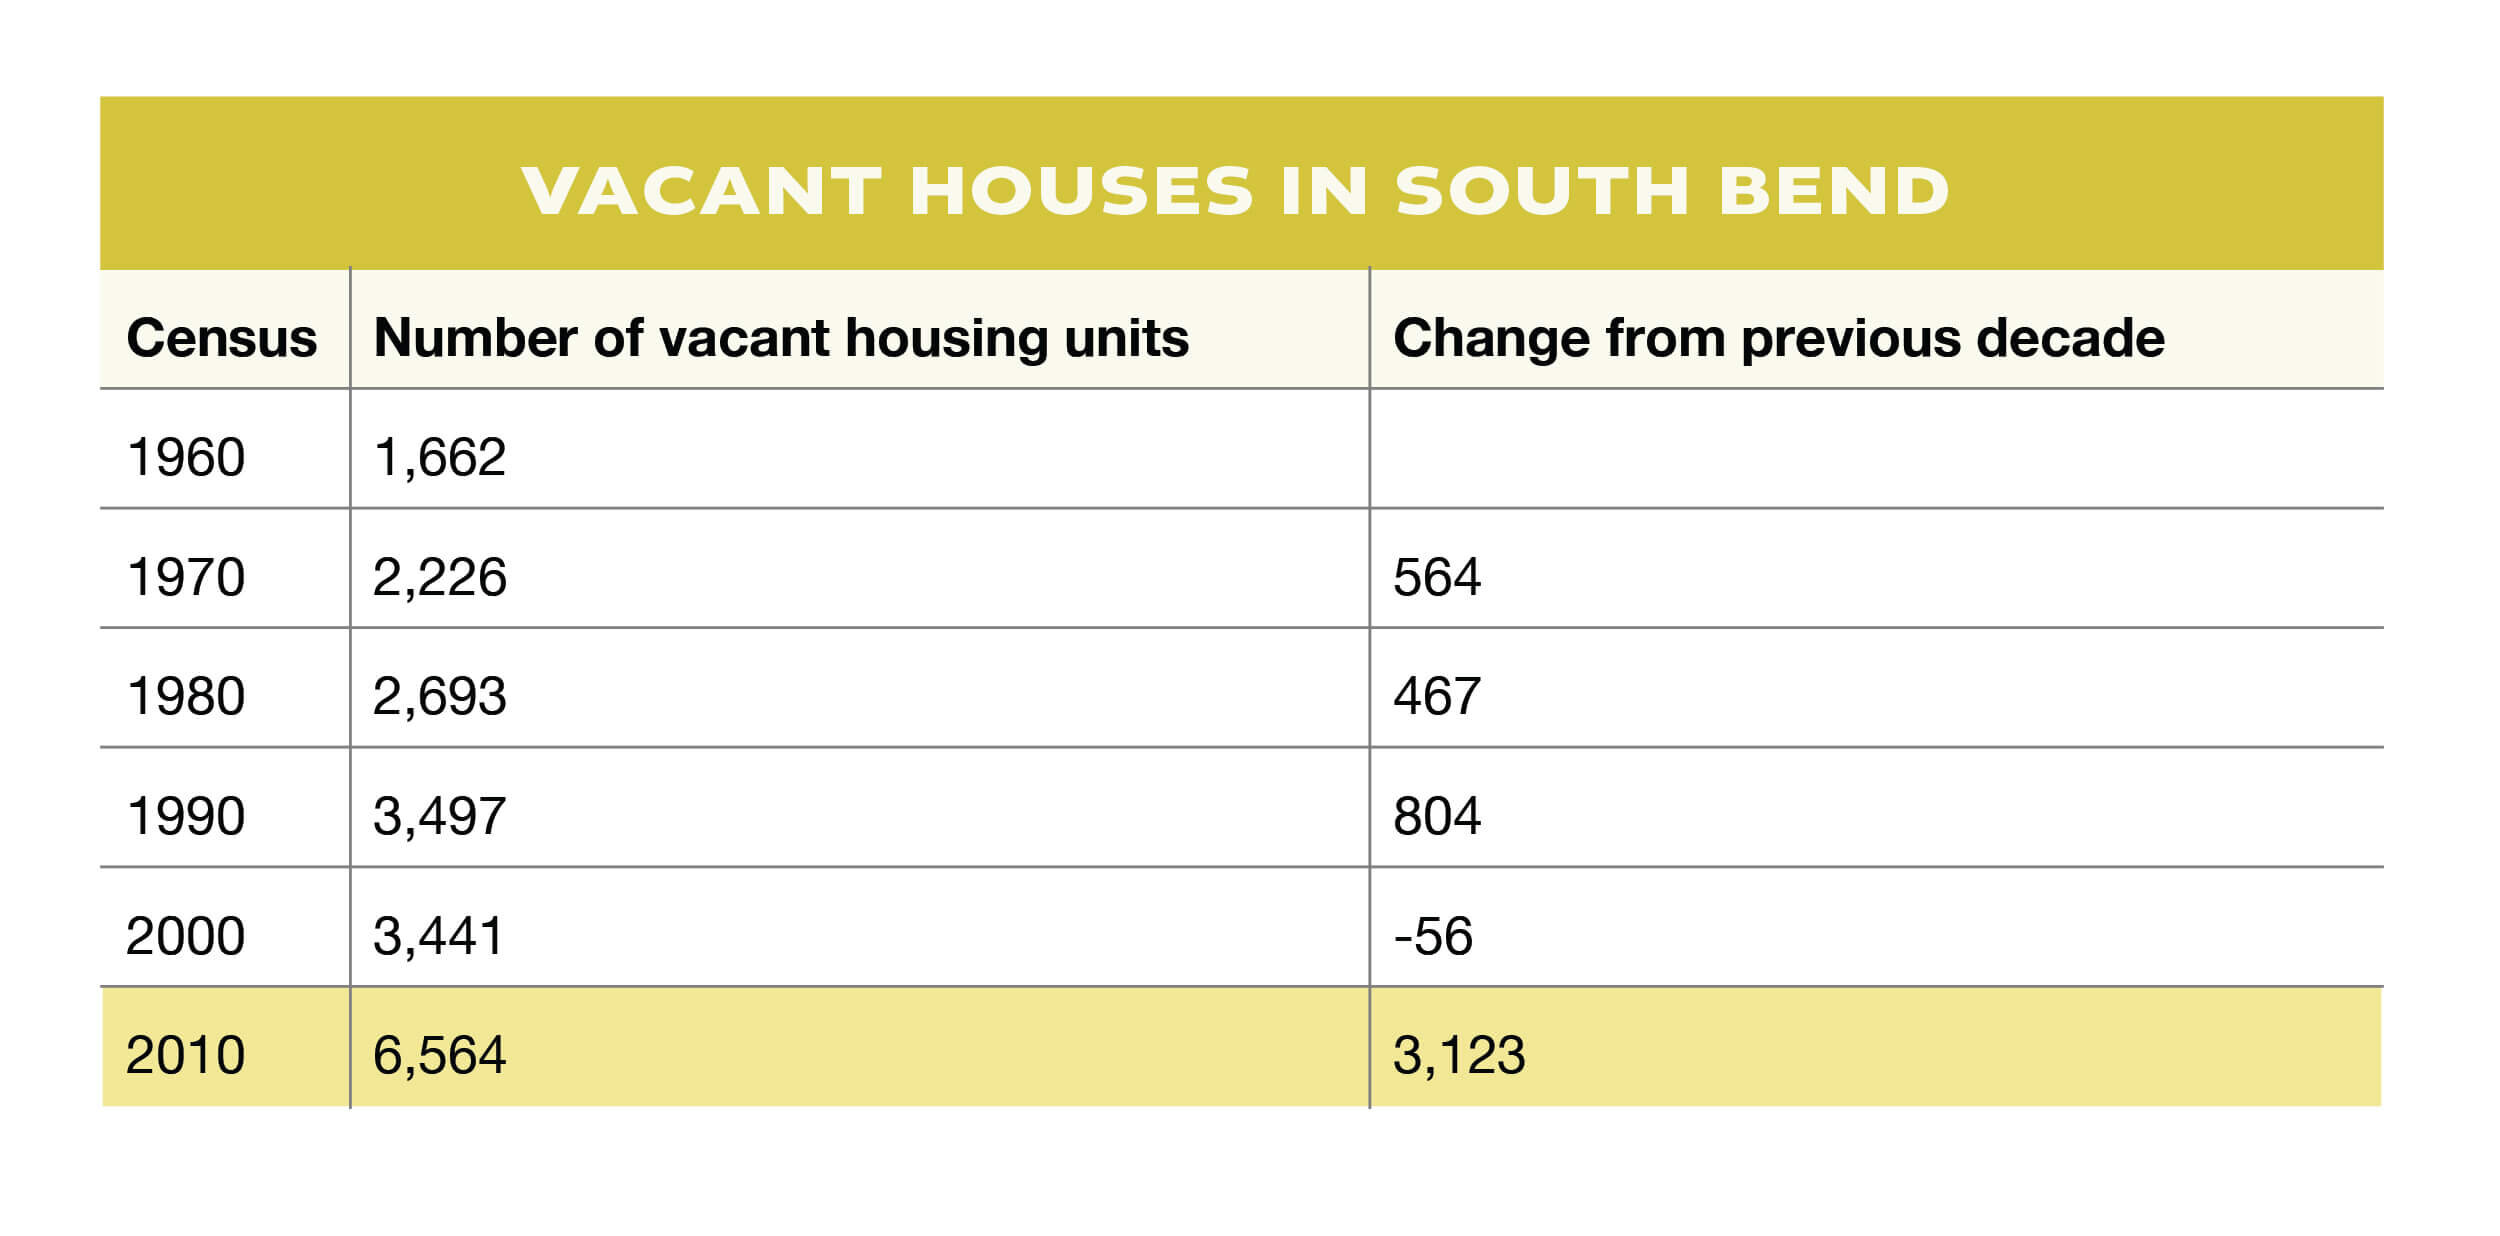
With households dropping through the decade, and foreclosures far too common, it was inevitable that the number of vacant addresses would increase as well. South Bend saw a steady rise in the number of vacant households throughout the second half of the 20th century – although it’s important to note the number of vacant addresses fell in the 1990s – but the increase in the 2000s was dramatic. It took three decades for the number of vacant units to essentially double from 1,662 in 1960 to 3,497 in 1990, but in just one decade, it nearly doubled again from 3,441 in 2000 to 6,564 in 2010.
As many residents of South Bend know, a vacant and abandoned house acts like a poison for the entire block. Abandoned houses cause problems for neighbors not just because the grass is never mowed and the windows are boarded up, but far more dangerous problems develop over time. Abandoned homes are more likely to catch fire than occupied houses. They also serve as a meeting place for illicit and illegal activities. And typically, because they’re poorly secured, children can access houses that are structurally unfit and suffer from dangerous accidents. This is not even to speak of the harm which abandoned homes play in decreasing property values for the entire neighborhood.
By 2013, the city determined there were over 1,900 properties identified as vacant, with 1,275 of the properties abandoned as well.⁶ A large portion of these abandoned homes were in the central areas of South Bend. Freefall Neighborhoods suffered the worst during the 2000s and account for a large amount of the newly vacated addresses.
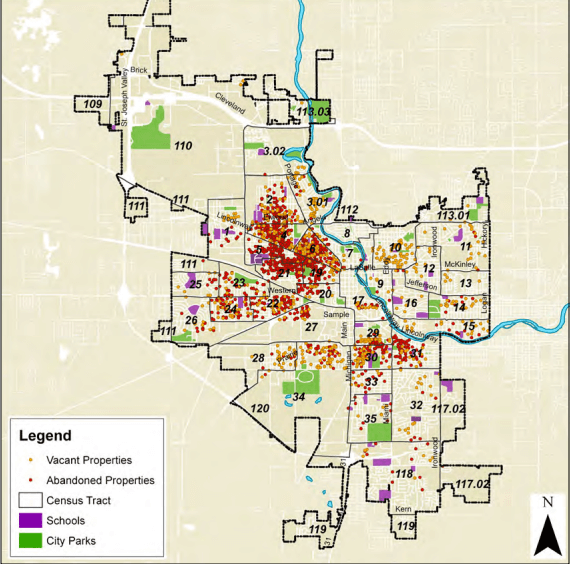
Vacant and abandoned properties identified by City of South Bend, Vacant & Abandoned Properties Task Force Report 2013
The sheer scale of the decline is hard to capture, but neighborhood-level analysis can be illustrative. In the first article, I described one subset of neighborhoods as “Freefall Neighborhoods”, those areas that declined in both number of households and in average household size. Residents – in just a matter of a couple of years’ time – watched their neighborhoods empty out before them.
Below are two pictures of the same four blocks before and after the 2000s. The pictures show this collapse at a human scaled level.
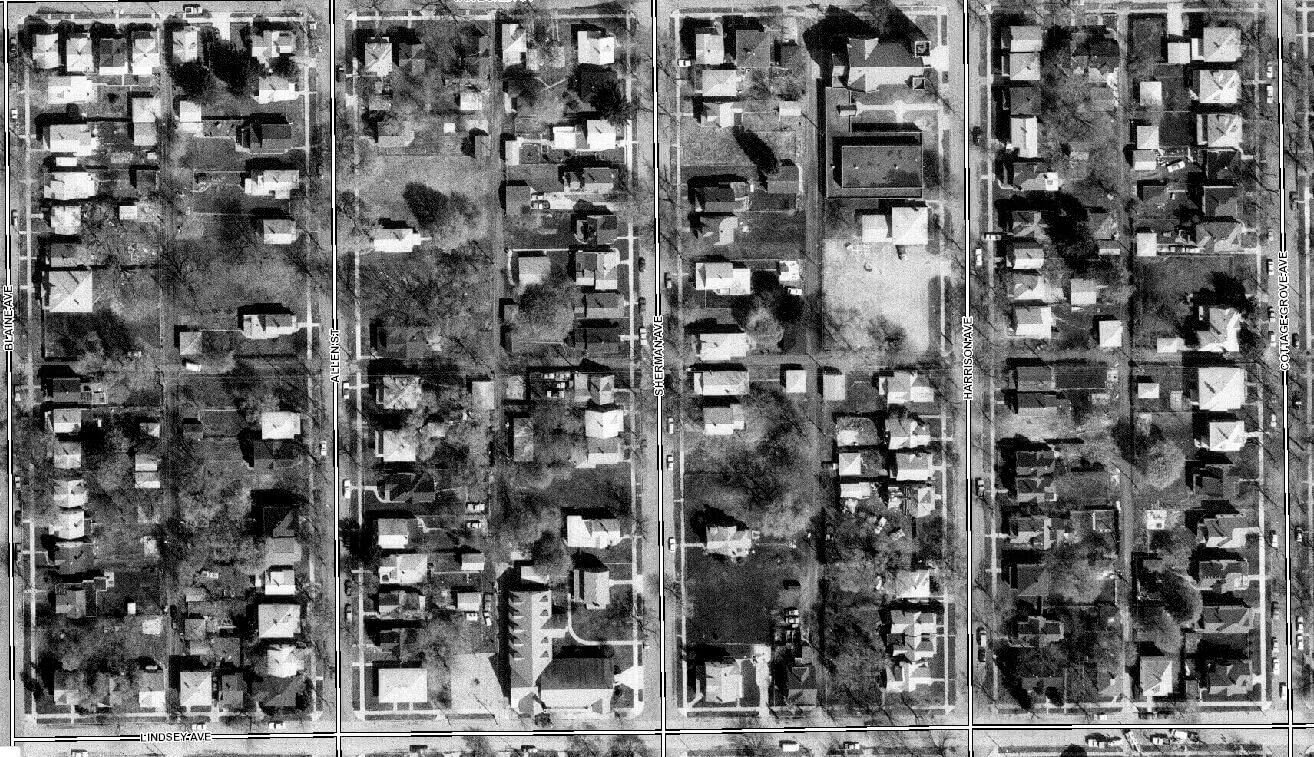
Four blocks in the Near Northwest Neighborhood, 1998 Aerial Sourced MACOG
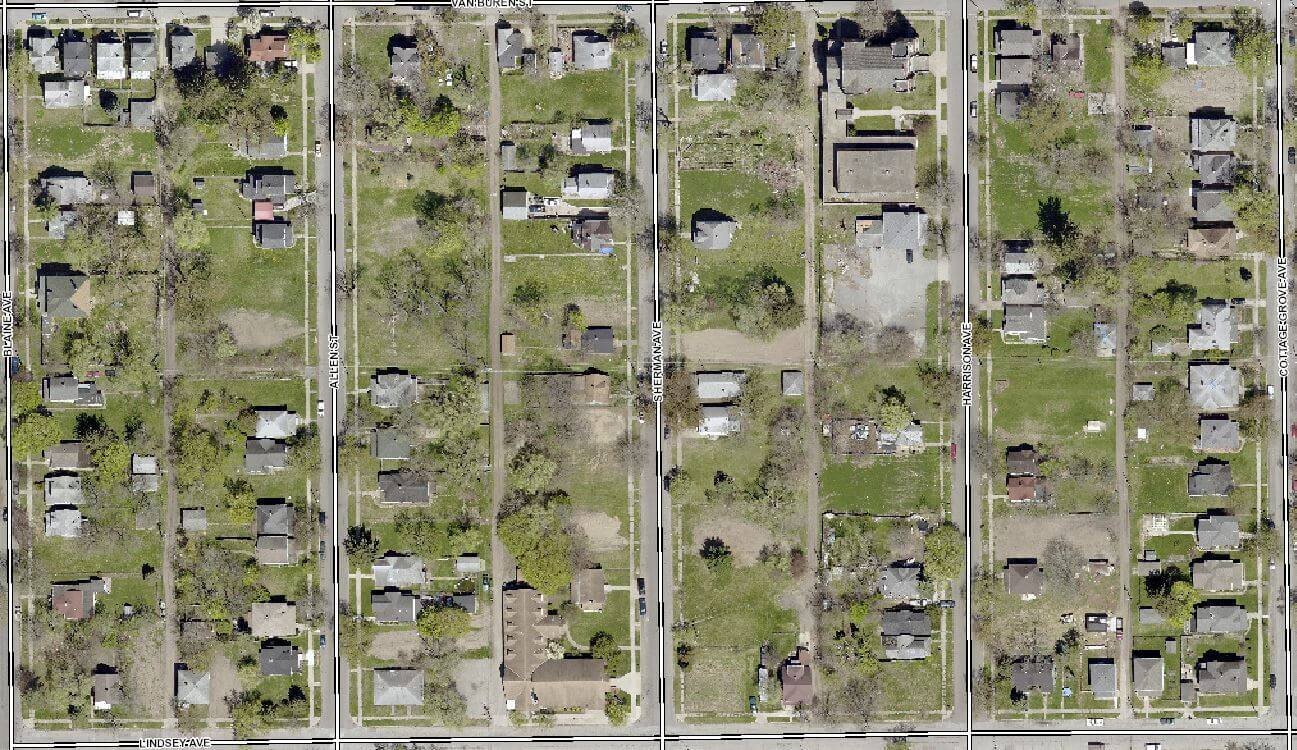
Four blocks in the Near Northwest Neighborhood, 2015 Aerial Sourced MACOG
The two satellite images above – the first taken in 1998 and the second in 2015 – show the same blocks situated in the Near Northwest Neighborhood just north of Lincolnway West. In 1998, the four blocks were very much part of a larger intact neighborhood. While there are a few vacant lots and potentially a few unoccupied houses, the image shows a fully built-out neighborhood. The 2015 image, however, tells a far different story. Every street has lost housing, and, in some cases, over 50% of their households. This collapse of a neighborhoods population in the 2000s was not because Studebaker closed in the 1960s.
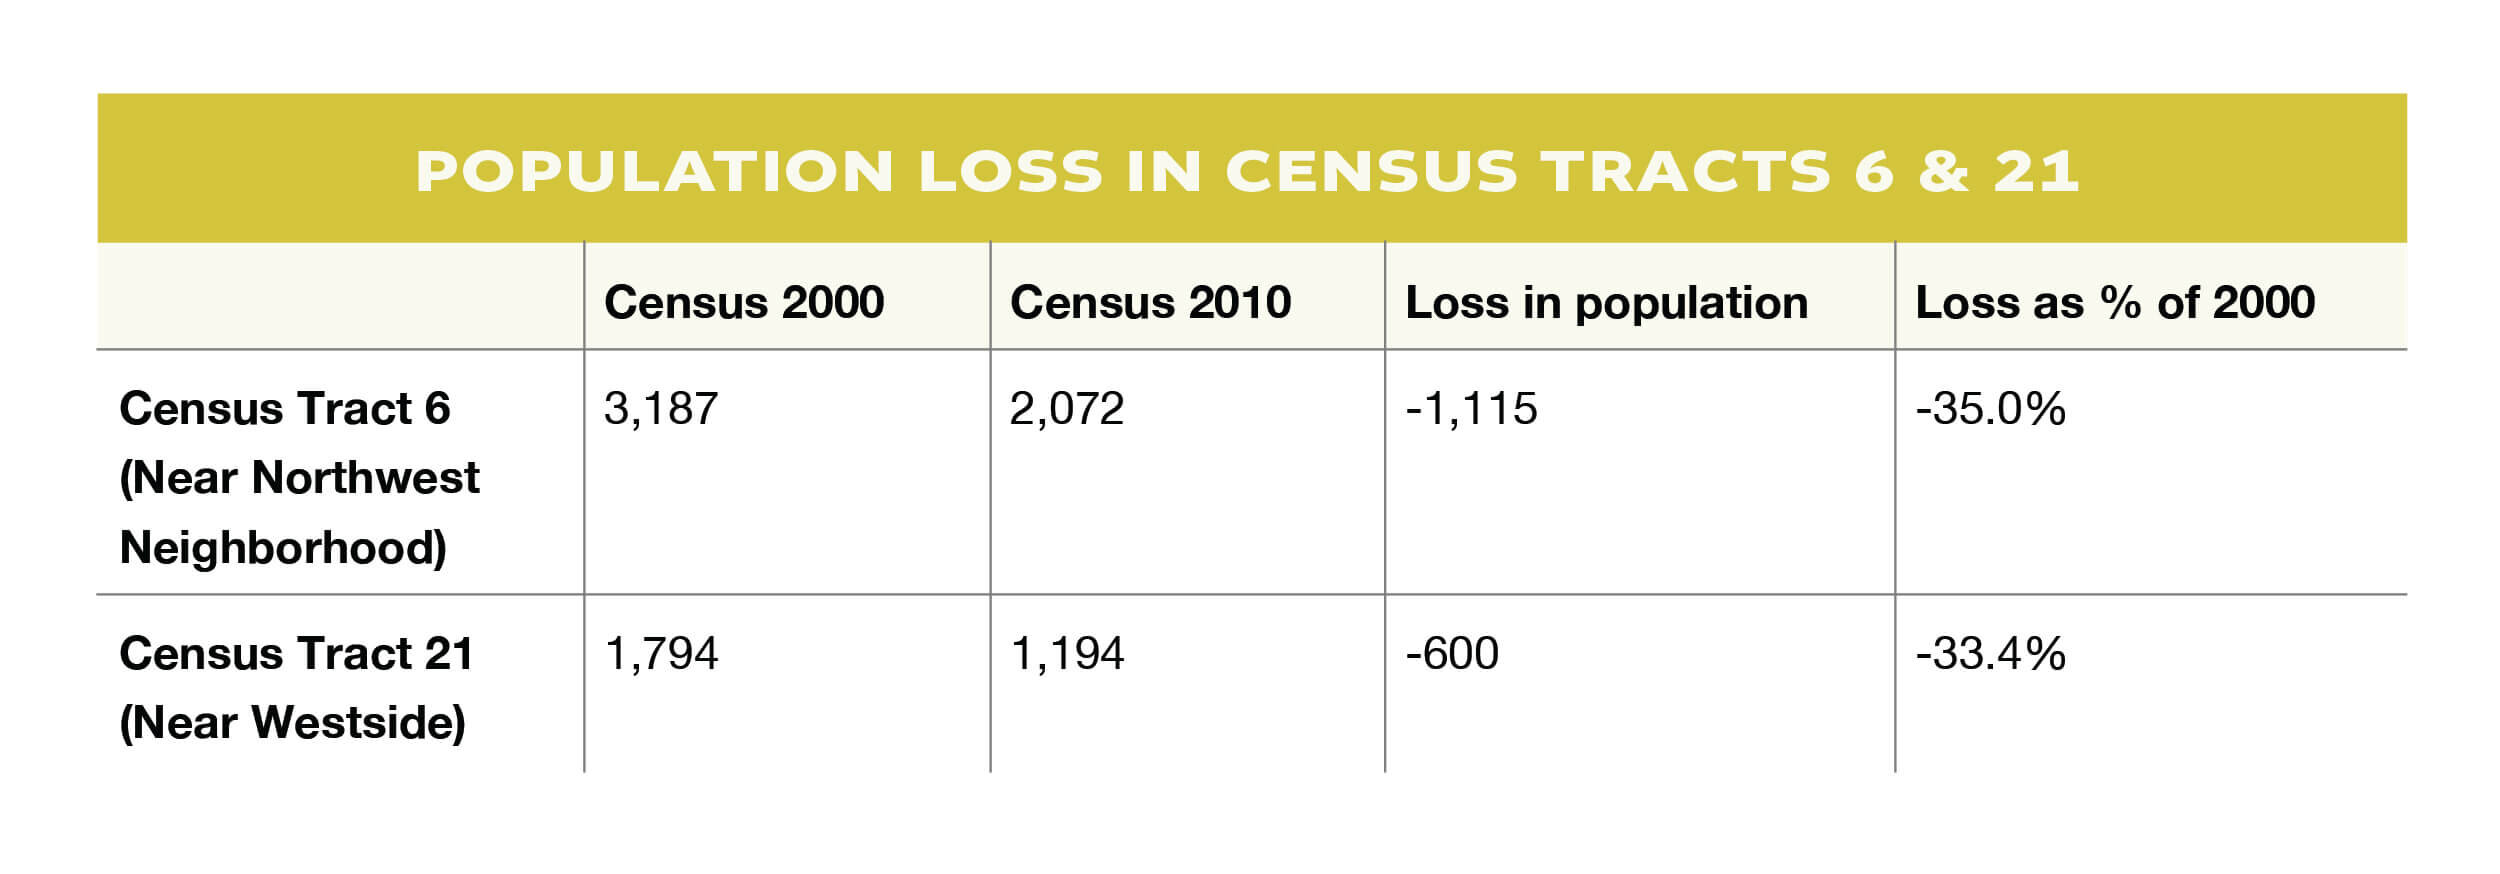
The blocks shown above are part of Census Tract 6. According to the 2000 census, this tract was home to 3,187 people. By 2010, the population plummeted to 2,072, for a loss of 1,115 residents or 35%. The 1998 image and the corresponding 2015 image make more sense when realizing that over a third of the people left this neighborhood in one decade. While it’s understandably troubling that South Bend lost about a quarter of its population between 1950 to 2000, Tract 6 lost a larger percentage in a single decade. This should be gut-wrenching to anyone who cares about South Bend.
Neighborhoods losing large percentages of their households – much larger than the average 7.5% for South Bend as a whole – was common for most of South Bend’s poorer and majority-minority neighborhoods. Let’s look at another example to demonstrate the breadth of this collapse.
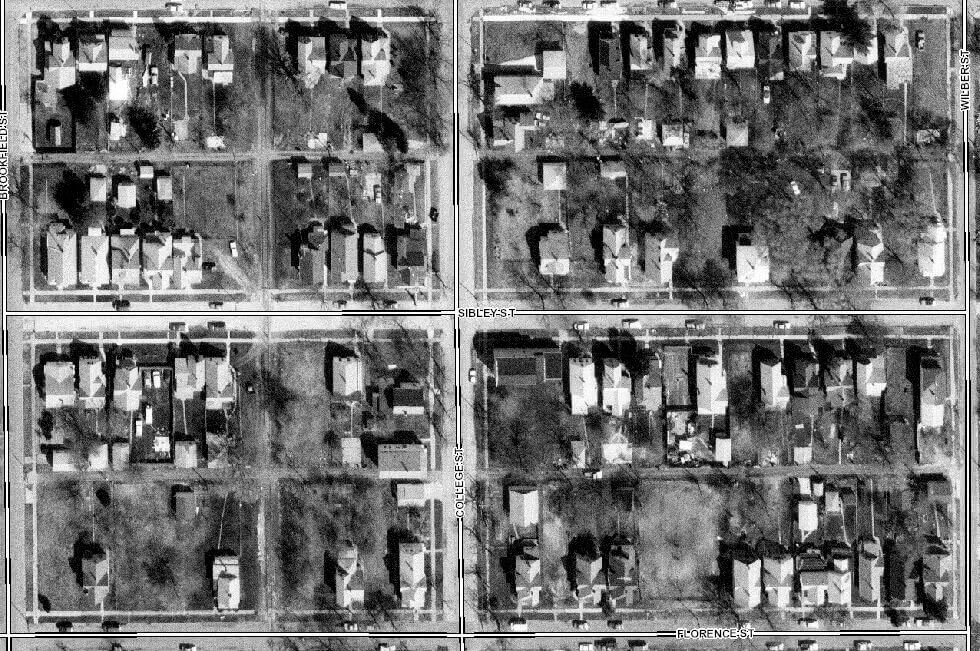
Four blocks in the Near Westside, 1998
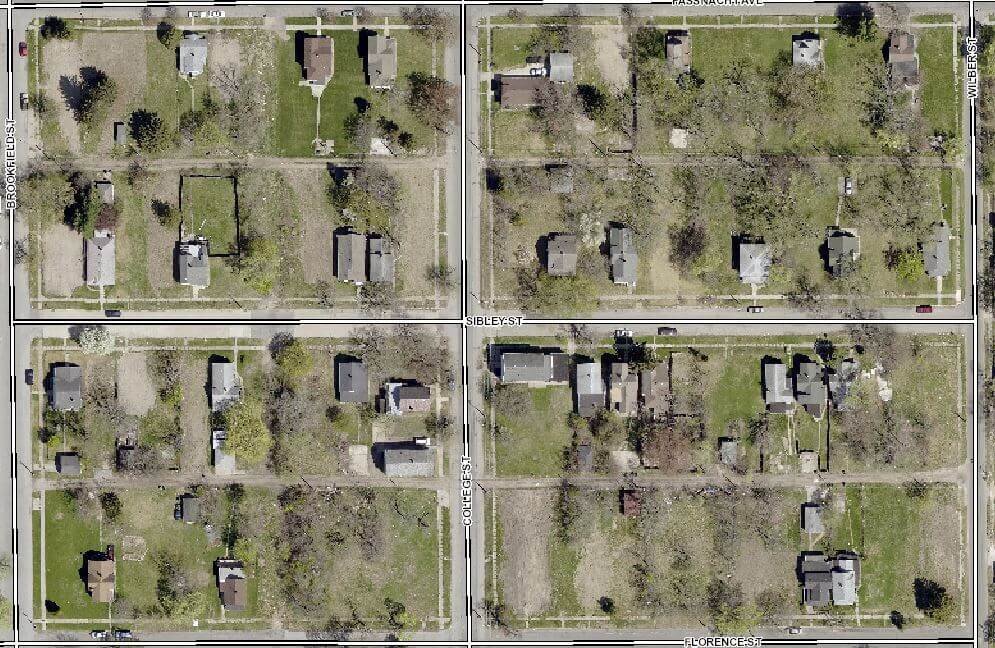
Four blocks in the Near Westside, 2015
Above are satellite images of four blocks on the Near Westside, again in 1998 and 2015. The images tell the same story as those before them. In 1998, the neighborhood had the occasional vacant lot, but by 2015 the vacant lots appear to outnumber the houses. These blocks are in Census Tract 21. Like Tract 6, the neighborhood lost 33% of its population during the 2000s, dropping from 1,794 residents in 2000 to 1,194 in 2010.
The reason we can see the collapse of households so vividly is primarily due to the “1000 Houses in 1000 Days” initiative begun under Mayor Pete Buttigieg after the findings of the Vacant and Abandoned Task Force were released. The goal was the rehab or tear down 1000 vacant houses in 1000 days. As Mayor Buttigieg ran for president in 2019 and 2020, this program came under intense scrutiny.
This is not the proper place to discuss if the program was managed equitably or not, but I bring this up to demonstrate that the plague of abandoned houses South Bend experienced was a direct result of the 2000s. Many times, when national news outlets attempted to explain the program, they pointed to the fact South Bend had been losing population since the 1960s as the cause for the vacant houses. As this series has attempted to demonstrate, the number of households increased throughout the latter half of the 20th century – and the number of vacant houses fell during the 1990s – abandoned housing only became a severe issue for the city after losing over 3,000 households in one decade. South Bend needed a program like “1,000 Houses” not because Studebaker collapsed four decades prior, as many news outlets would have led you to believe, but because of the housing crisis in the 2000s.
Poverty increases/income inequality
In 1960, at the beginning of population decline in South Bend, families in the City of South Bend had slightly higher average income than the average for Mishawaka and St. Joseph County as a whole. Below is a chart tracking family income in South Bend, Mishawaka, and the entirety of St. Joseph County.⁷
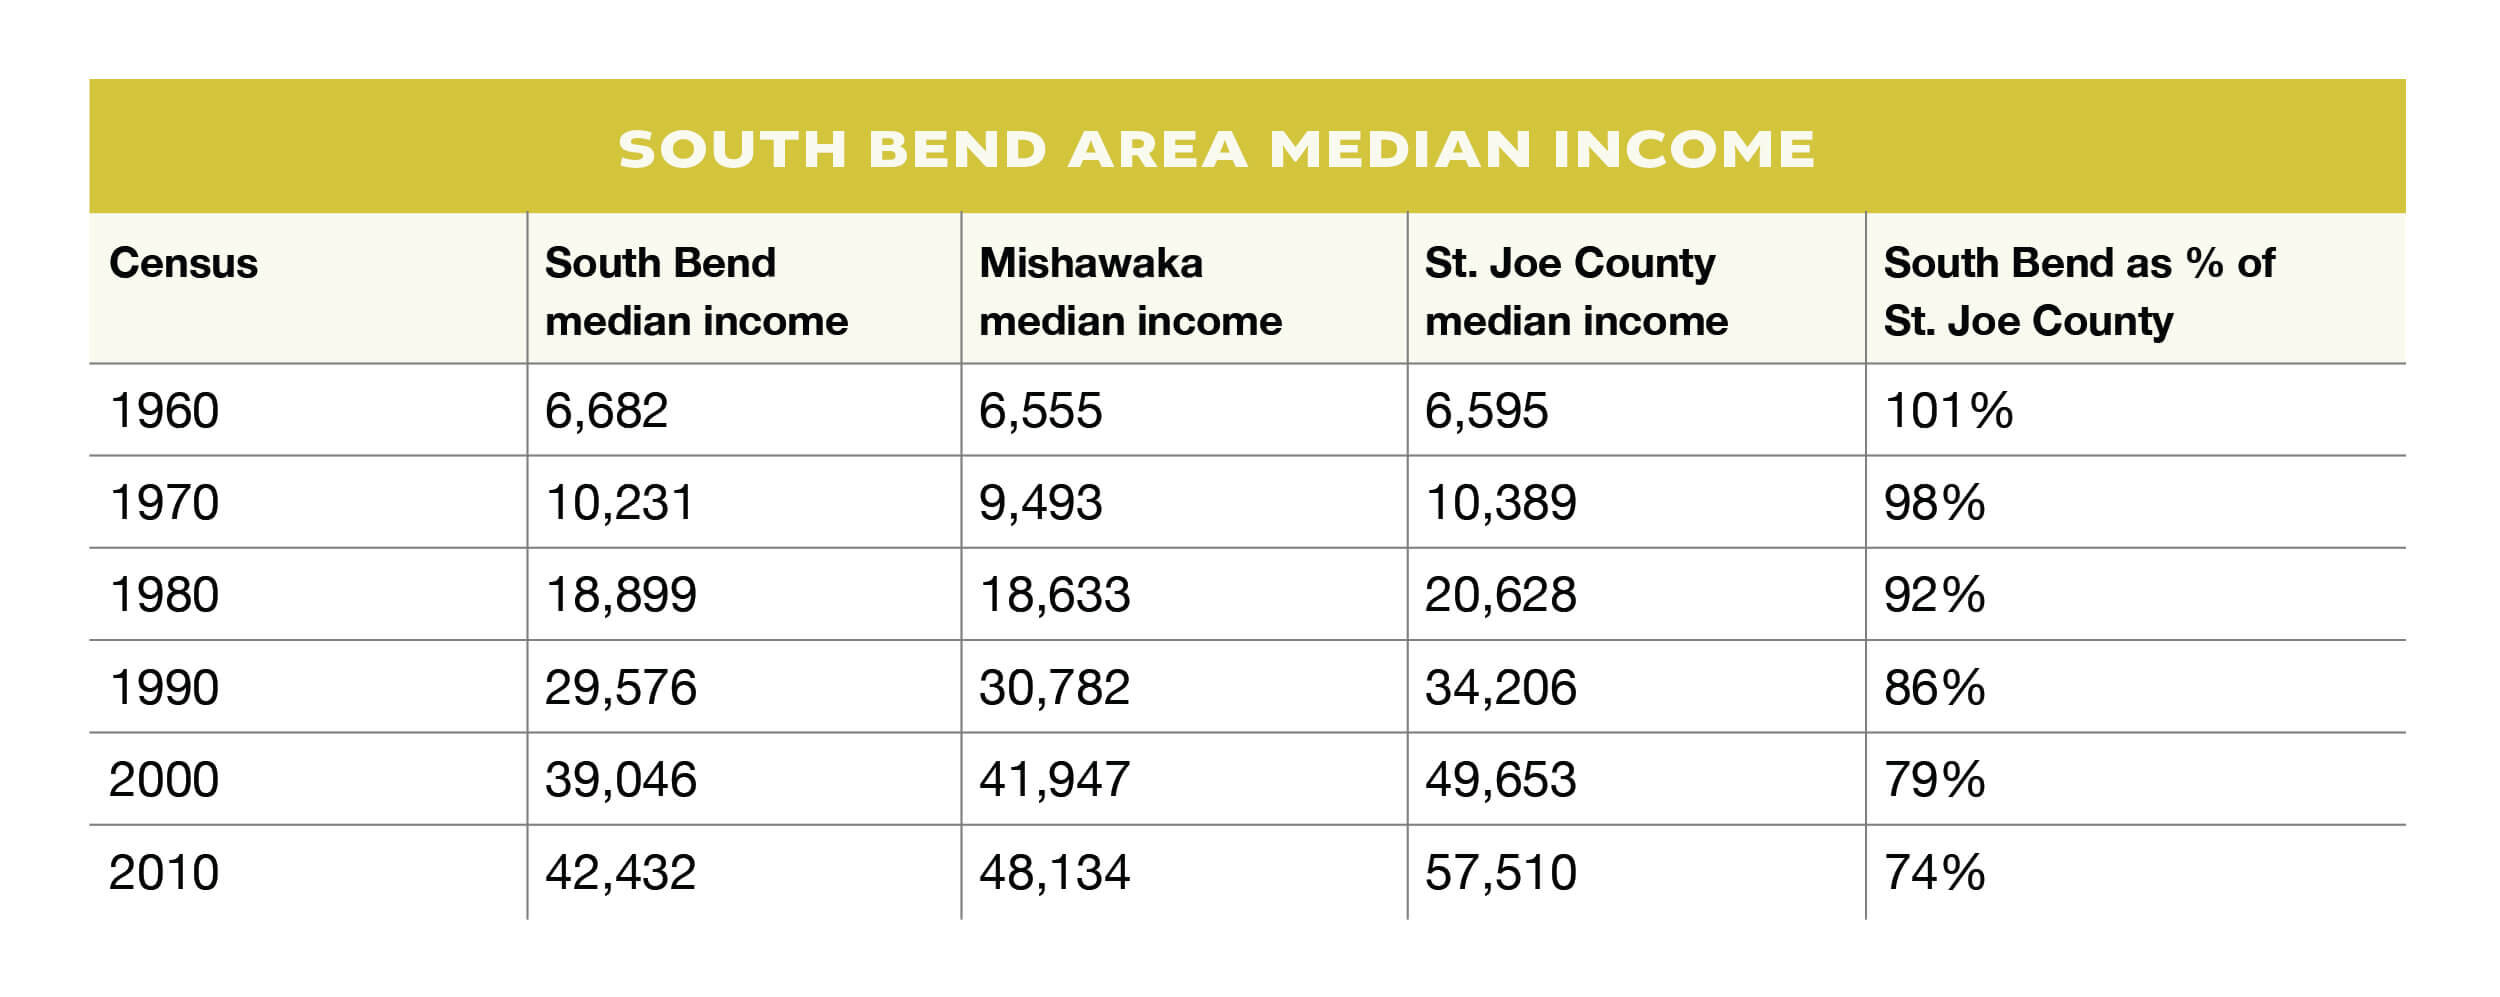
Unlike population decline, the relative decrease in South Bend’s average median income to the overall St. Joseph County median income has been steady over the past six decades. In superstar coastal cities, like Los Angelos, New York City, Boston, and San Francisco, the central city is the most expensive and wealthiest location in their respective metro regions. Many times, the wealthiest and most expensive zip codes can be found in the limits of the primary city. This is rarely – if ever – the case for Rust Belt cities.
When the Great Recession hit South Bend in 2008, residents were greatly impacted by the damage. The bursting housing bubble erased a large degree of wealth for South Bend residents that did not return as quickly as it did in suburban areas where housing prices bounced back faster. The unemployment rate rose and remained in double digits for multiple years.
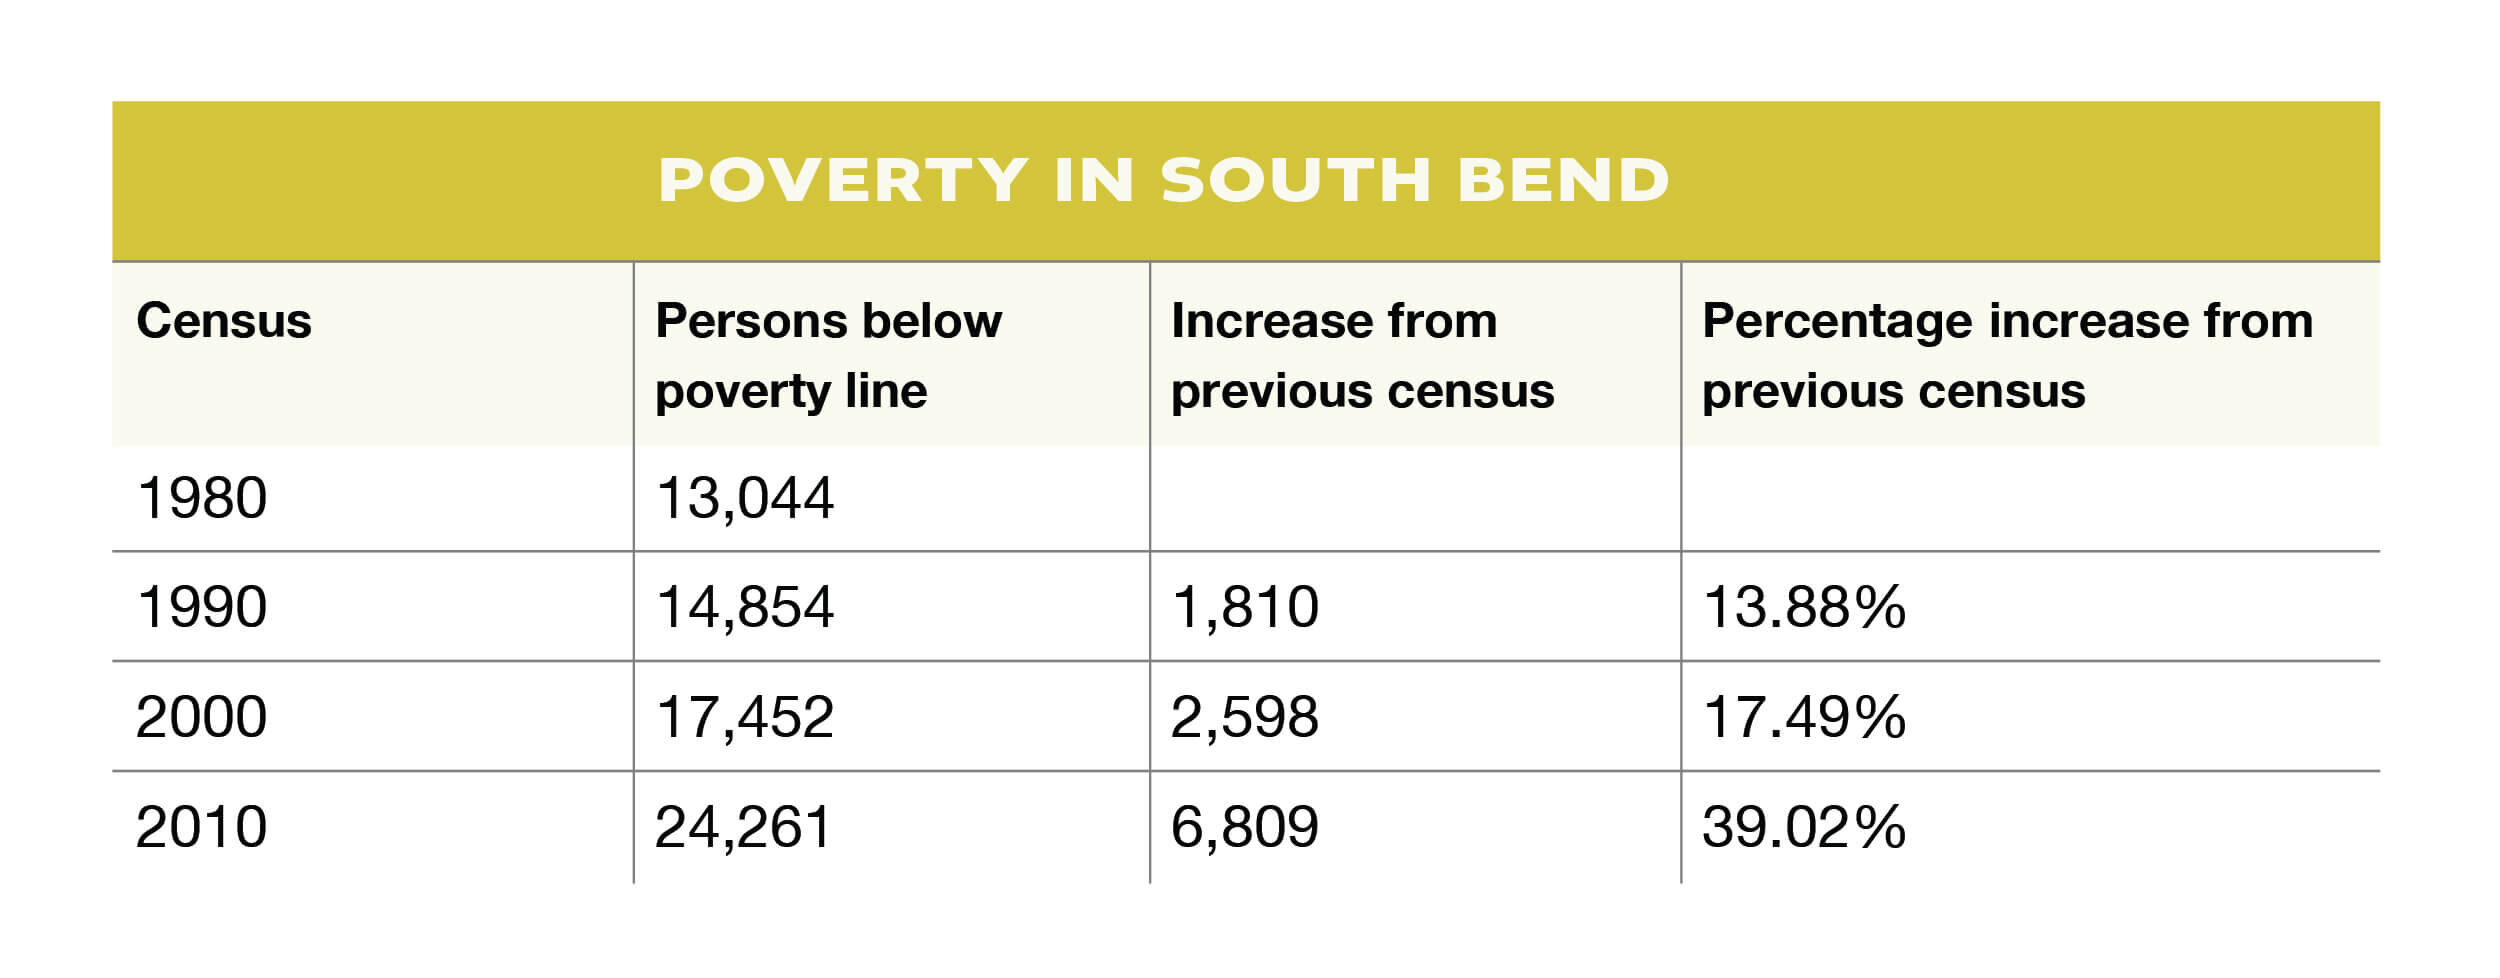
As seen in the chart below, poverty rose in South Bend throughout the 1980s and 90s, but the numbers dramatically increased in the 2000s. At a time when South Bend shrank by over 6,000 people, the number of its residents below the poverty line increased by nearly 7,000.
The question can be asked, if this series is a history of population decline in South Bend, why detail poverty and income rates? As most homebuyers know, neighborhoods today are largely occupied by individuals of similar economic status. When poverty grew in South Bend, it hit the neighborhoods detailed above the hardest. As once stable, if poor, neighborhoods lost hundreds of people, the residents who remained were poorer on average than they had been just a decade before. The chance of new investments or new individuals moving into a neighborhood where a large portion of the population is impoverished is slim to none. The housing bubble crash begot a foreclosure crisis, which led to a vacant properties crisis. Vacant properties further pushed down property values, and declining property values forced more people to leave, limiting the amount of people willing to move to a neighborhood and causing more vacant housing units. A vicious cycle which tore many South Bend neighborhoods apart.
There’s more to say about the housing bubble and Great Recession than can be explored in this series’ limited scope. For example, I have not touched on how banks often targeted African American neighborhoods for ARMs and other inscrutable loans. There is a wealth of great literature being built on this important period of our history such as Evicted: Poverty and Profit in the American City by Matthew Desmond, which I encourage anyone interested in learning further to read.
Both issues – the housing bubble and Great Recession - in tandem took a city with neighborhoods on the edge of viability in the early 2000s and pushed it over the cliff. Five decades of deindustrialization hollowed out the economic base, urban renewal wrecked the urban core, and suburbanization pulled wealth away from the city. This left South Bend (and so many similar Rust Belt cities) specifically vulnerable to a housing-crash-induced recession, the result of which was the first decline in the number of households in South Bend history and a tragic blow to her most vulnerable neighborhoods.
As with Tiny Town, South Bend has been through a rough time. But despite all of this, I’m a firm believer that South Bend today is a wonderful place to call home. Our architecture, cultural and civic amenities, and urban neighborhoods can provide a quality of life far better than can be expected in a small city in northern Indiana. Throughout this past decade, South Bend has many indicators demonstrating that our days of decline are hopefully behind us. In the 2020 census – if accurate – we’ll see if the drastic reversal of the 2000s was a one-time blip in our household growth or the troubling beginning of a larger pattern.
• • •
This series has served to tell the history of population decline in South Bend or “How South Bend lost 50,000 people in fifty years.” In some ways, that premise has been completed. We have analyzed individual neighborhood decline and traversed the five decades from 1960 through 2010 when South Bend lost population through two very different types of population decline encompassed in those decades.
However, there are a few unanswered questions which need to be addressed before finishing the series. The first of which: Why does any of this matter? Why does it matter that South Bend lost population both to itself and the outside world? Why does it matter that as South Bend shrank, St. Joseph County and the larger metro area continued to grow? And finally, what are the consequences of this history and how or should South Bend address this challenge?
The following articles in the series will attempt to answer these questions. Thank you for reading this series so far. The response has been humbling and encouraging. Hopefully you will continue to do so.