More People: Jobs Stayed in South Bend, but Employees Left

This is the introduction to an article and podcast series by Joe Molnar titled More People: How South Bend Lost 50,000 People in 50 Years. Joe is a proud 4th generation son of South Bend.
Read the original series: Introduction | One | Two | Three | Four | Five | Six | Seven
Read the census recap: Introduction | One | Two
Subscribe to the podcast: Apple | Spotify | Google | Stitcher | TuneIn
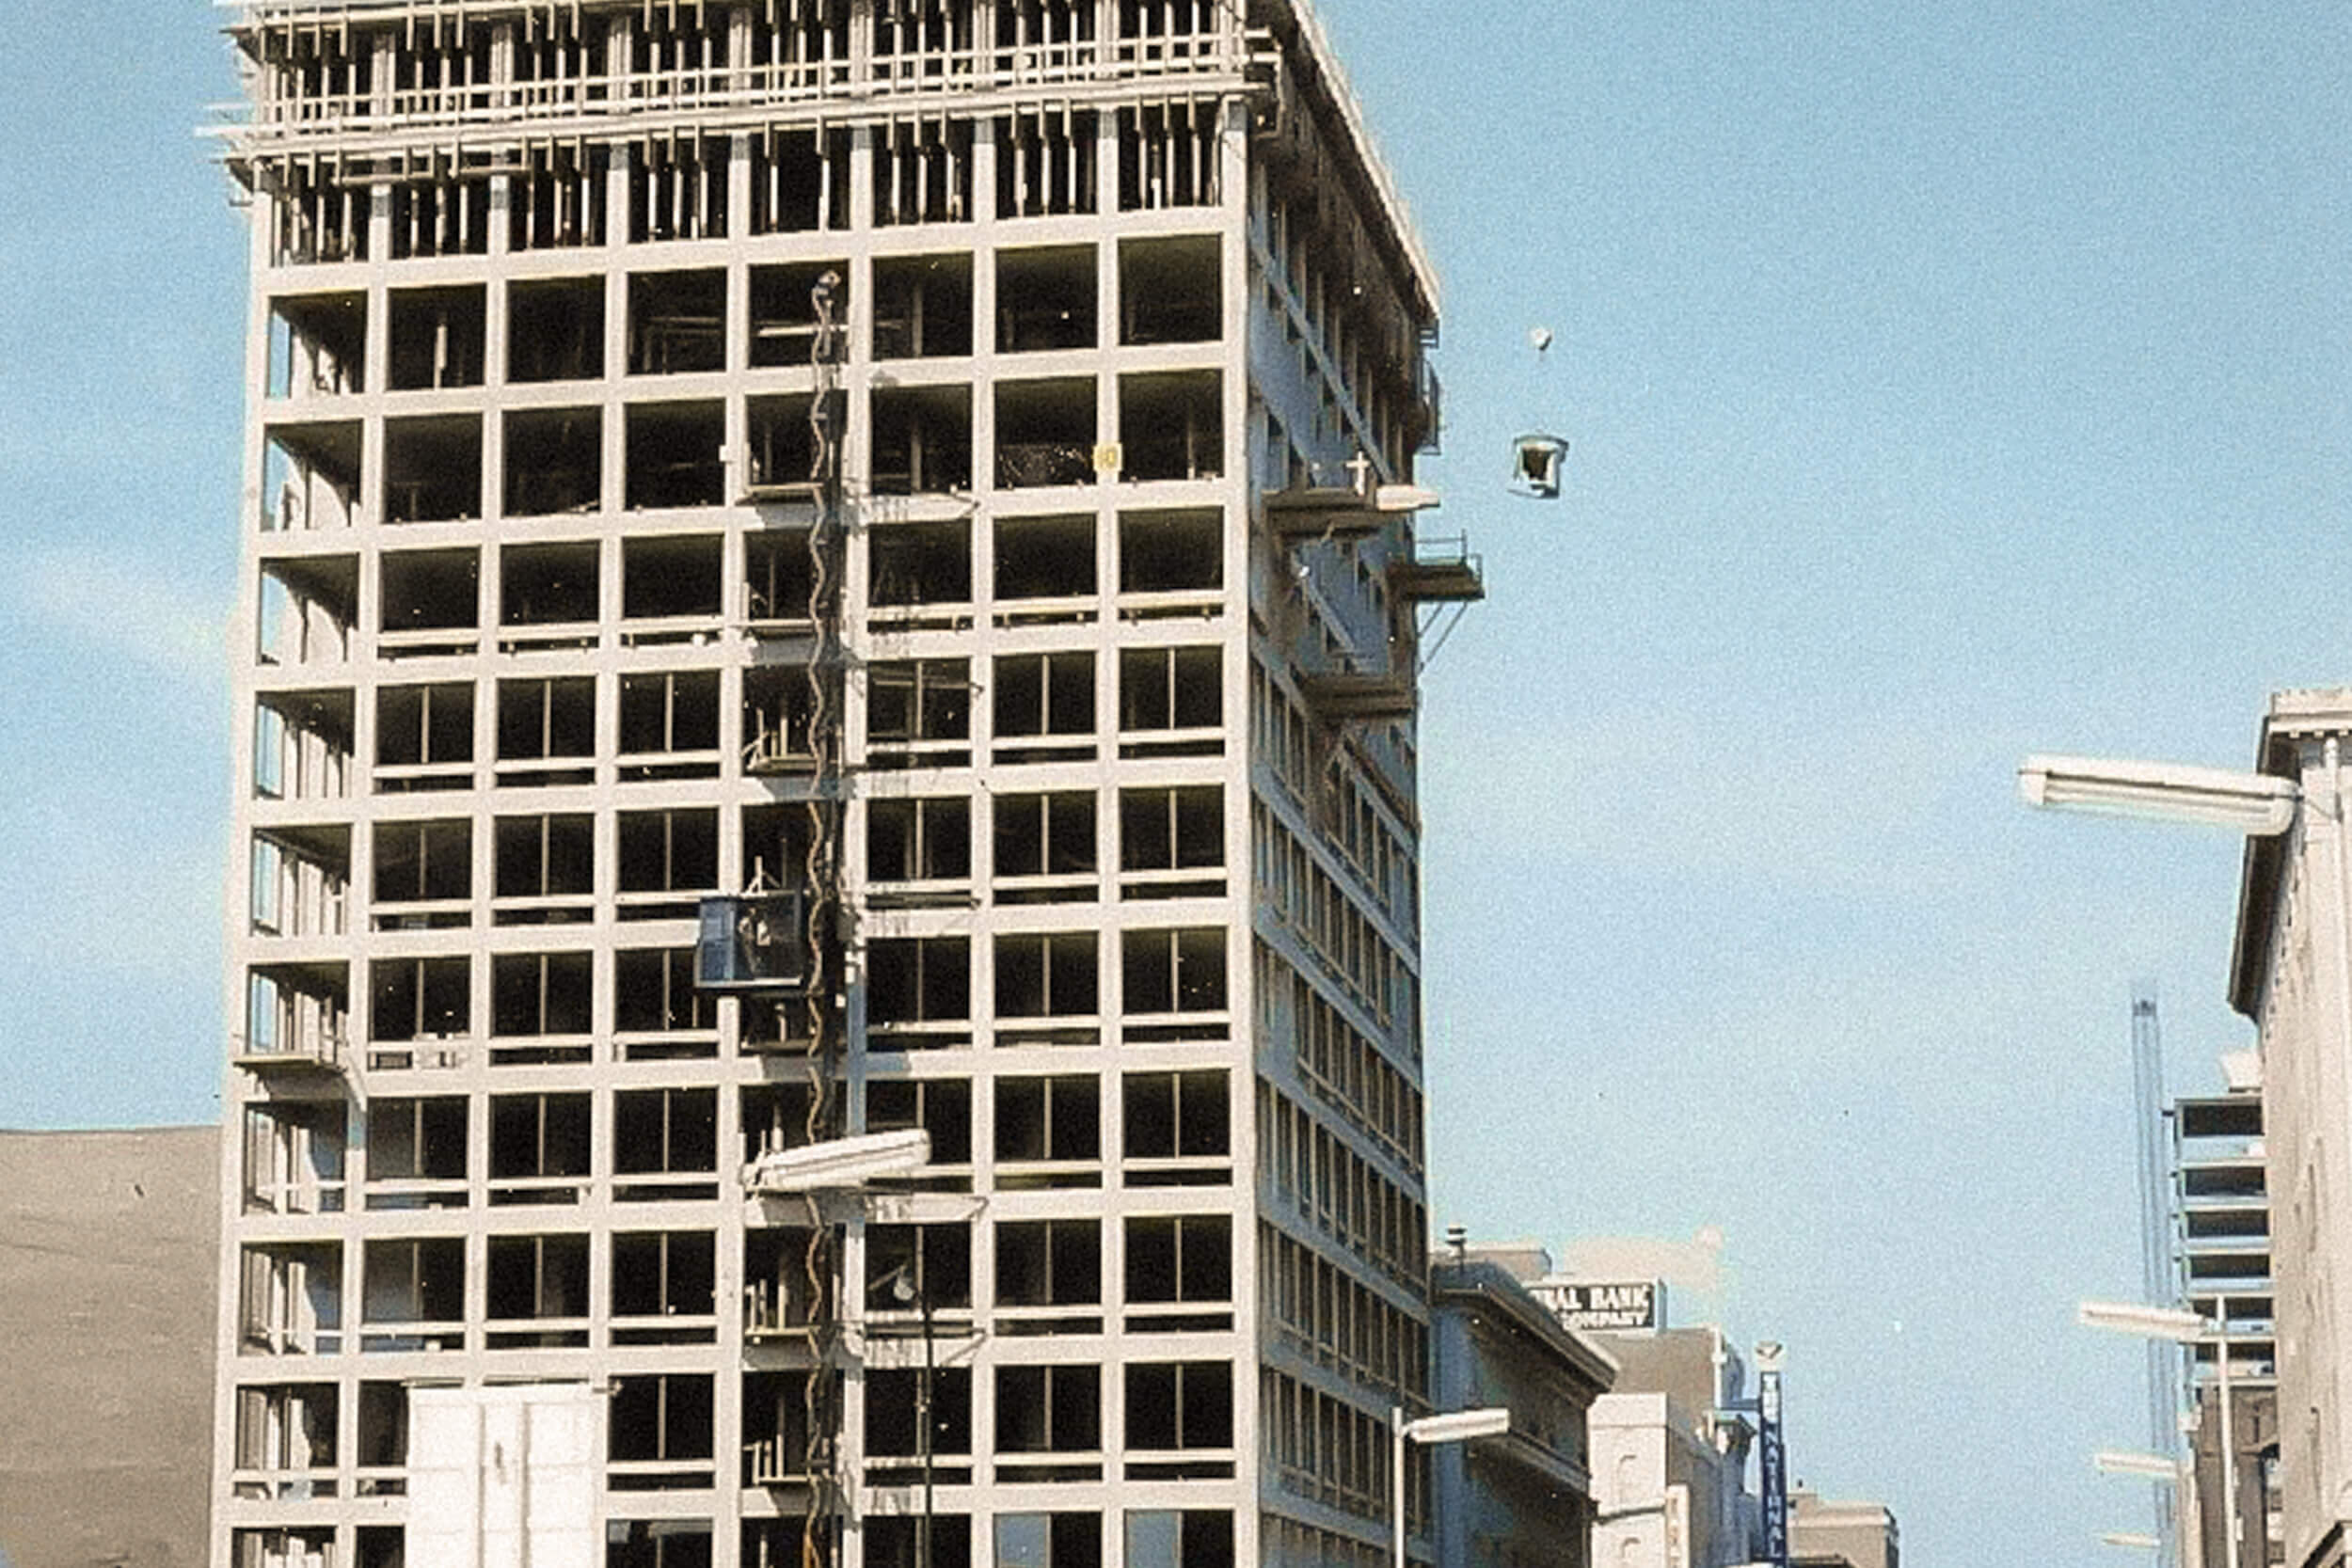
Construction of the St. Joseph Bank Building, now known as the Key Bank Building, on Jefferson Boulevard in 1969.
“This is not Studebaker, Indiana. This is South Bend, Indiana.”
– Paul D. Gilbert, December 1963¹
• • •
The story we’re told – the story we all believe – is that South Bend is a poor city. We can look at the median income and it clearly shows our households are less wealthy than most other areas. Our schools struggle and we deduce it’s because South Bend residents are less fortunate than others. We look at our crime rate and blame it on the high poverty rate of our citizens. We’re especially poor in comparison to the rest of the county and, in turn, the rest of the United States.
Everyone has their own version of why this happened – all some flavor of decline in the number and quality of jobs, with varying scapegoats:
Factories and their well-paying jobs gave South Bend cause to grow and prosper, but now the factories are gone, and the good jobs outsourced, and the city is structurally poorer because of it.
The city was run into the ground by Democrats.
The unions pushed away the good jobs.
A particularly pernicious one -- “high crime rates scared away employers.
Everyone on the political spectrum latches onto whichever specific boogeyman will propel their agenda and they’re convinced that’s what caused South Bend’s population decline. Most of these are false.
What if I told you, South Bend has plenty of well-paying jobs? In fact, what if I told you Mishawaka and St. Joseph County have a larger percentage of low-paying jobs than South Bend? Decades of suburbanization and white flight have led us to believe that all well-paying jobs have left South Bend. But that’s not true. The problem is not that South Bend does not have well-paying jobs, but that its residents do not hold them.
So far, the “More People” series has detailed the population collapse South Bend endured over the past 60 years. The story has been sobering. The goal has been to shed light on this process of depopulation and hopefully to illustrate how South Bend’s decline has more to do with shrinking household size, suburbanization, and the housing crash than any other issue.
Despite my best efforts, however, there are those who still contend I am only nibbling around the edges of the true story. These responses typically give one of three related statements:
South Bend lost population because all the jobs left.
South Bend is a poor, depopulated city because well-paying factory jobs went to other parts of the county or left the region entirely.
South Bend has done nothing to combat deindustrialization and spur job growth.
Myth One: South Bend lost population because all the jobs left.
As of 2017, in the entirety of St. Joe County, there was 123,945 jobs – a full 57,841 of those were in the city limits of South Bend². As the below chart demonstrates, South Bend has a larger share of jobs than it does population in both St. Joe County and the entire metro area. Most jobs did not leave the city, the employees who hold those jobs did. Note that South Bend population and job numbers are included in the St. Joe County and Metro totals. Both job and population estimates are shown for the most up to date year available.
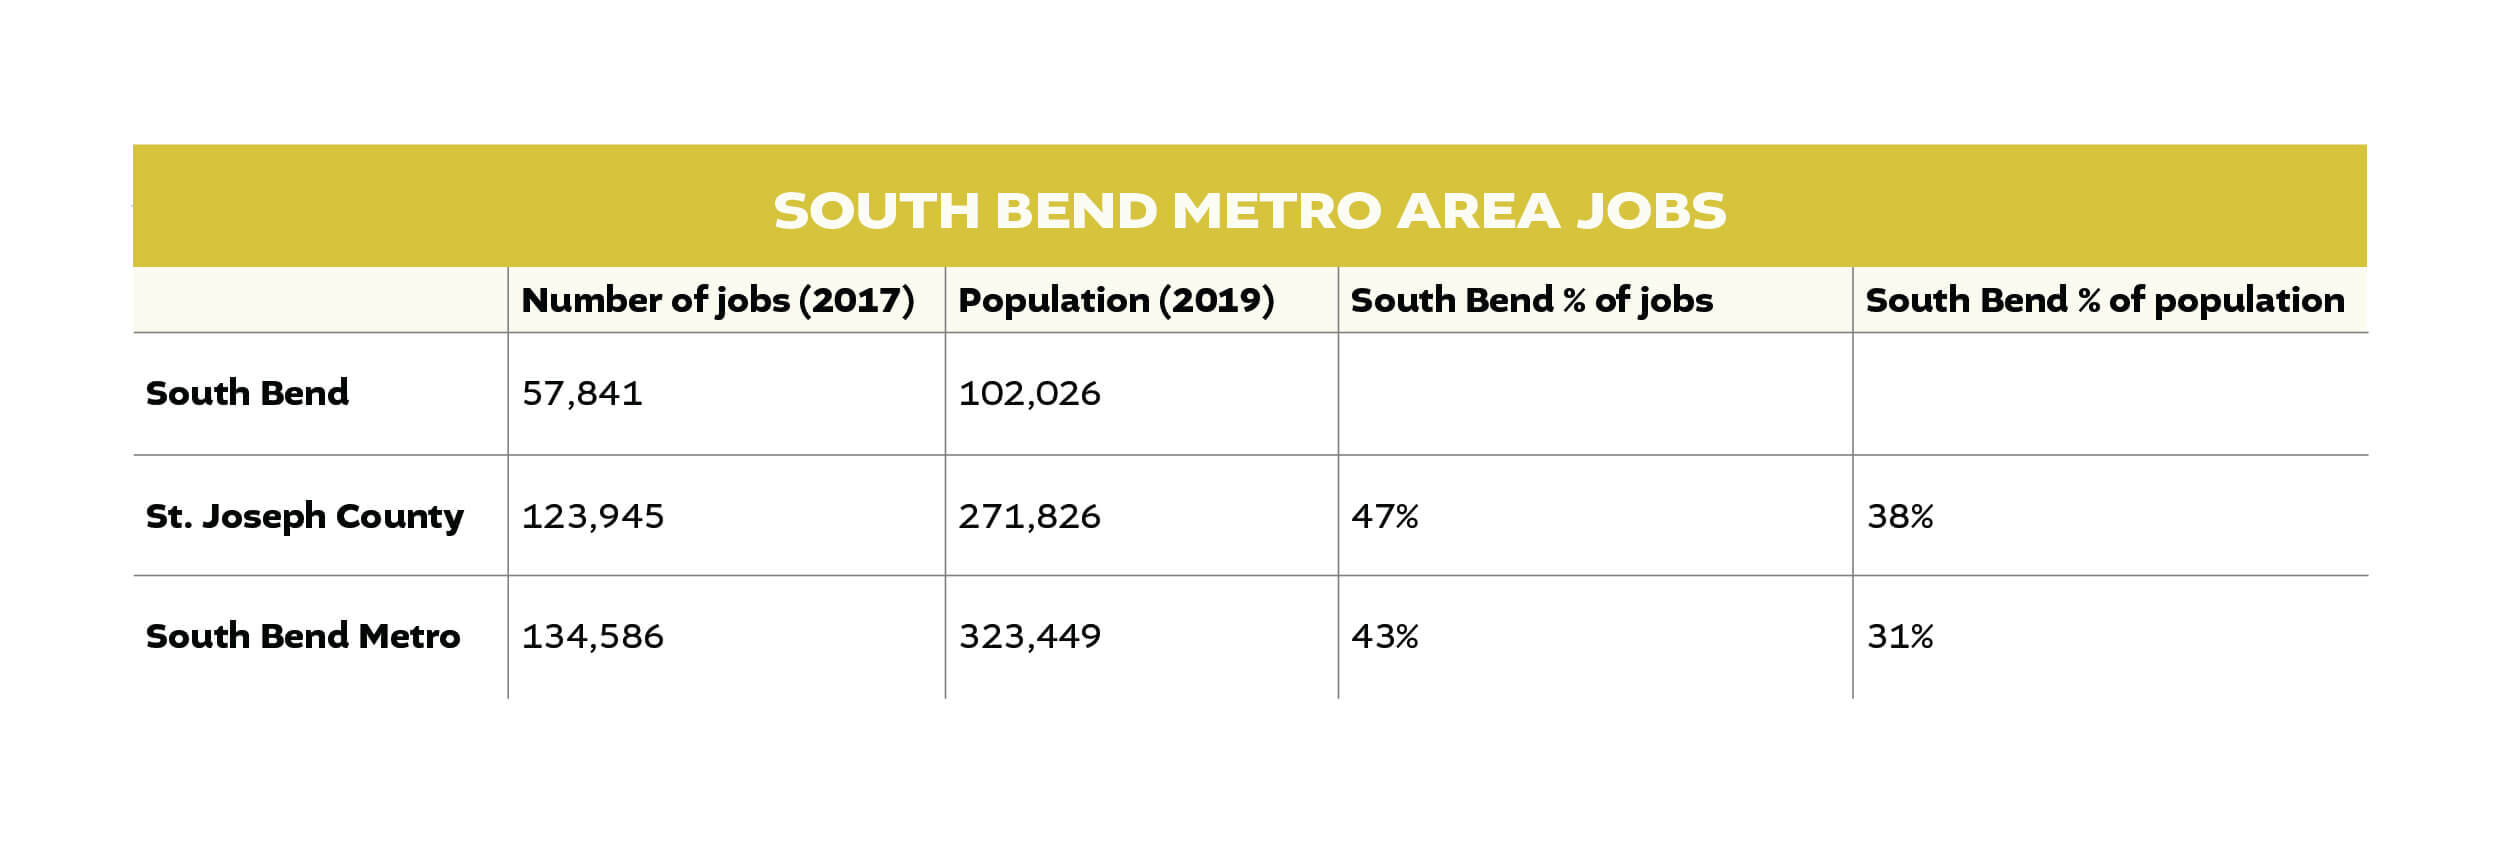
Despite South Bend only making up 38% of our county’s population, entities within the city limits generate 47% of the jobs. The numbers are even more skewed at a metro level where South Bend accounts for only 31% of the total population, but 43% of the jobs. Therefore, South Bend produces nearly 40% more jobs than it does residents at the metro level.
The above numbers for South Bend do not include most jobs at the University of Notre Dame. Some people may not know that Notre Dame is not in the city limits of South Bend. Therefore, most of the ten thousand or so Notre Dame employees are added to only the St. Joe County numbers, not South Bend’s. If we added those employees to the South Bend count, the figures would be even more pronounced.
‘Myth One’ states South Bend lost so much population because there weren’t enough jobs to sustain the population, but the numbers reveal that this perception is not correct. South Bend produces far more jobs per population overall than St. Joe County; however, our county – as has been reported before in this series – has more people today than at any time before in its history. South Bend, however, has lost a quarter of its population.
According to the logic of ‘Myth One,’ jobs should roughly equal population. If this were the case, South Bend would have around 47% of the population of St. Joe County, which is about 128,000 people. Yet, South Bend is more than 25,000 people short of this number. The reason is because only residential population is used as the official population count. However, the Census Bureau has produced an assessment named Commuter Adjusted Population or Daytime Population figures. These figures refer to:
The number of people who are present in an area during typical business hours, including workers, children in school, people in hospitals or other short-term medical facilities, people temporarily staying in lodging facilities, and customers present at retail locations. This is in contrast to the “resident” population, which refers to people who reside in a given area and are typically present during the evening and nighttime hours.³
The daytime population of South Bend was last estimated to be 123,026. While not exactly the 128,000 figure we would get if population equaled jobs, it’s a whole lot closer than our residential population. Below, we can see the daytime and nighttime populations of South Bend and other St. Joe County jurisdictions. These figures were last compiled for 2010 (the nighttime population figures therefore are not the 2019 census estimates and use 2010 American Community Survey Estimates) and are slightly outdated; however, the overall trends have not likely changed significantly.
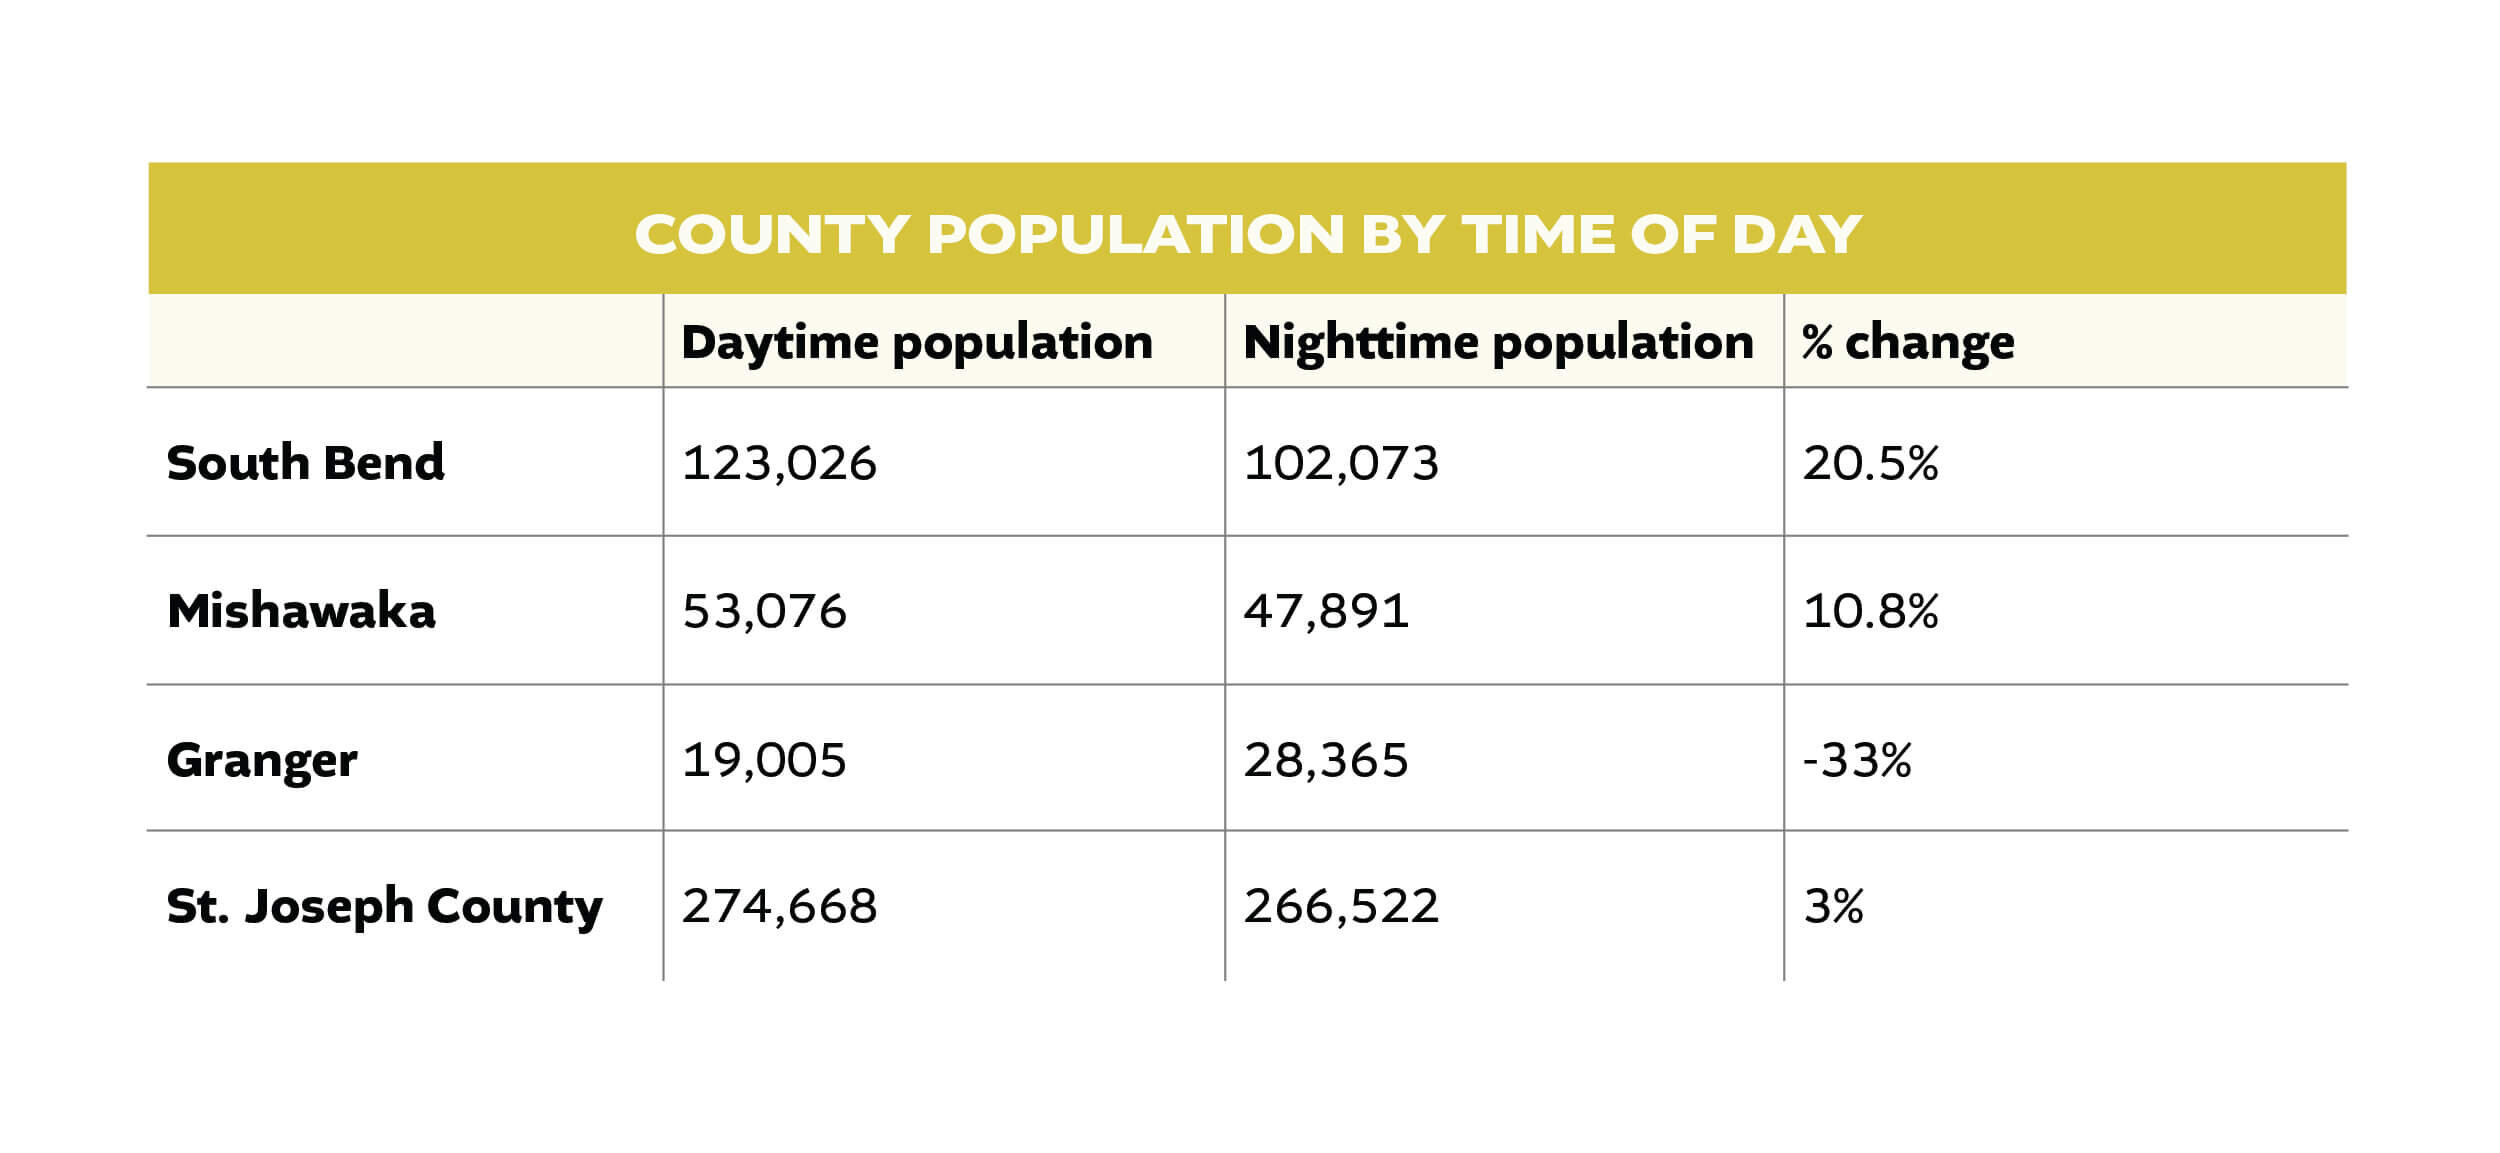
South Bend grows significantly every day as thousands of people from around the region flood into the city for their jobs and other cultural amenities. Mishawaka, to a smaller degree, also sees a rise in the number of people within its borders during the day compared to the residential population. Granger – which is being singled out as it is the only unincorporated area in St. Joe County besides Notre Dame that the Census Bureau tracks individually – sees the exact opposite effect. The neighborhoods empty out as residents go to their jobs largely in South Bend, Mishawaka, and Notre Dame.
If South Bend had a residential population that closely matched either its daytime population or its percentage share of jobs in the county, South Bend’s population would be around 125,000. This is a much smaller collapse from our height of 132,000 in 1960. Considering these numbers still account for declining household size, a drop of 8,000 or so residents is to be expected.
One final comparison to identify is how many jobs South Bend has compared to its residential populations. As of the 2017 figures, South Bend had 0.57 jobs per one person. At that same time, the United States had a level of just 0.49 jobs per one person.⁴ Just as with the figures explored above, its evidently clear that South Bend still has a large amount of jobs generated within its borders. While the argument can be made that this number, while still high, is lower than in previous decades, such as the 1950s. But ‘Myth One’ is not making that argument. The argument of ‘Myth One’ is that South Bend lost people because it is no longer a center for jobs. The data simply do not back this assertion.
Therefore, I find the argument that South Bend lost population for the past six decades because jobs left the city incomplete. Yes, losing a large share of manufacturing jobs was harmful to the city for the loss of property taxes, jobs, and sense of identity. What was more harmful – and a significantly larger factor of South Bend’s population decline – was when people who still worked in South Bend decided to move out to the suburbs.
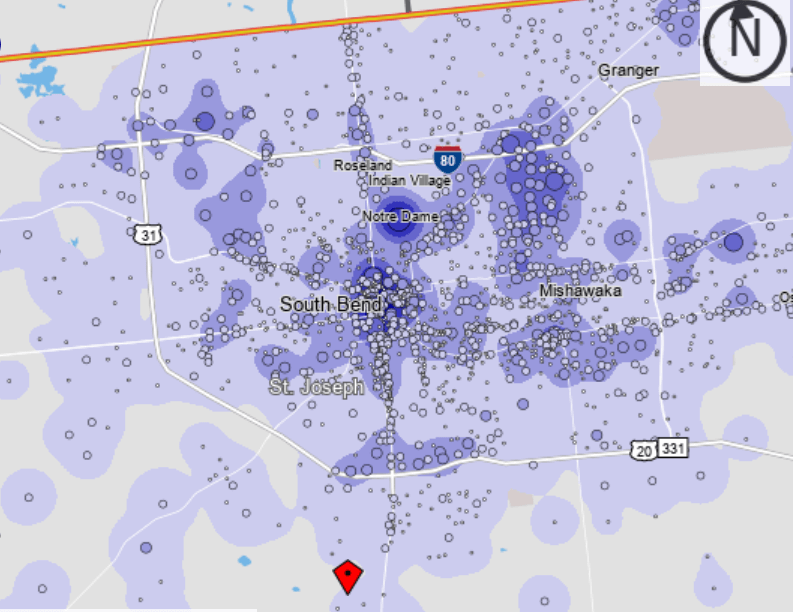
“Heat Map” of jobs in the South Bend region. Downtown South Bend has the highest concentration of jobs, followed by Notre Dame. Sourced from On The Map, Census Bureau.
Myth Two: South Bend is a poor, depopulated city because well-paying factory jobs went to other parts of the county or left the region entirely.
Beyond the declaration that South Bend lost jobs and therefore lost population, often a response will specify that the specific decline in manufacturing jobs led to the overall decline in South Bend’s population. The argument goes that, South Bend largely grew as a manufacturing center and these good-paying jobs helped fuel prosperity and growth in the city. As these jobs – Studebaker most famously – began to disappear, their loss doomed the city to population decline and economic hardship. We have already determined South Bend still has more than its fair share of jobs relative to its population size, but what if all those opportunities are simply low-paying jobs? Let’s look.
The Census Bureau breaks down the job figures into three categories based on monthly take-home pay. Those three brackets are: monthly pay below $1,251; monthly pay between $1,251 – $3,333; and monthly pay over $3,333. For simplicity, let’s label these different pay ranges as three income brackets: ‘Bottom Bracket,’ ‘Middle Bracket,’ and ‘Top Bracket.’
‘Myth Two’ claims the loss of well-paying jobs is the cause of South Bend’s population and economic decline. However, the numbers point to a different story. The chart below shows each jurisdiction’s jobs and the breakdown of those totals into each earnings category. For this chart, Notre Dame is considered its own jurisdiction.⁵
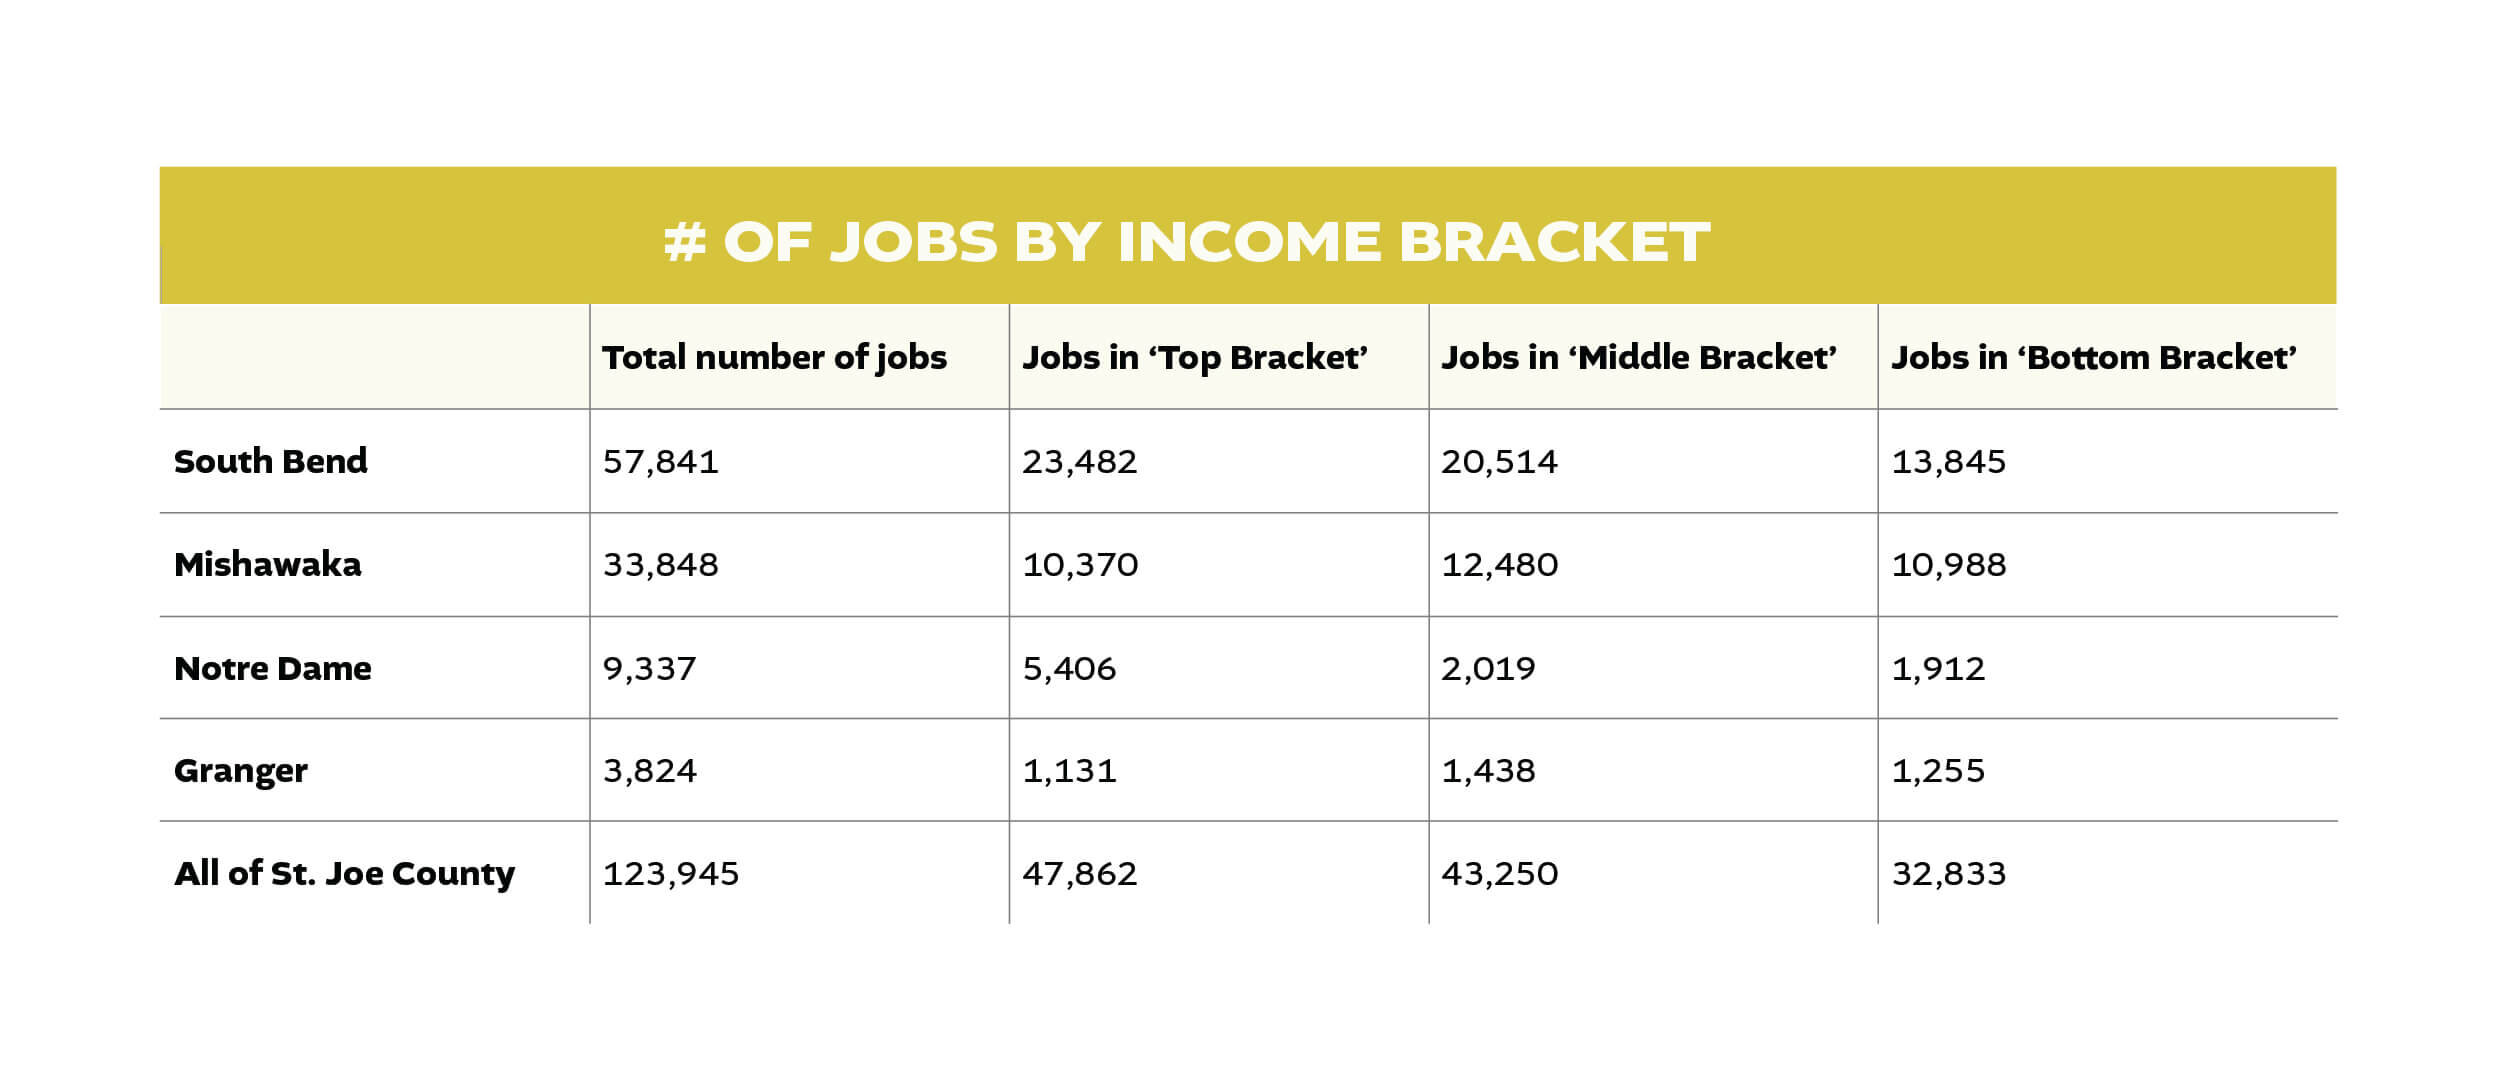
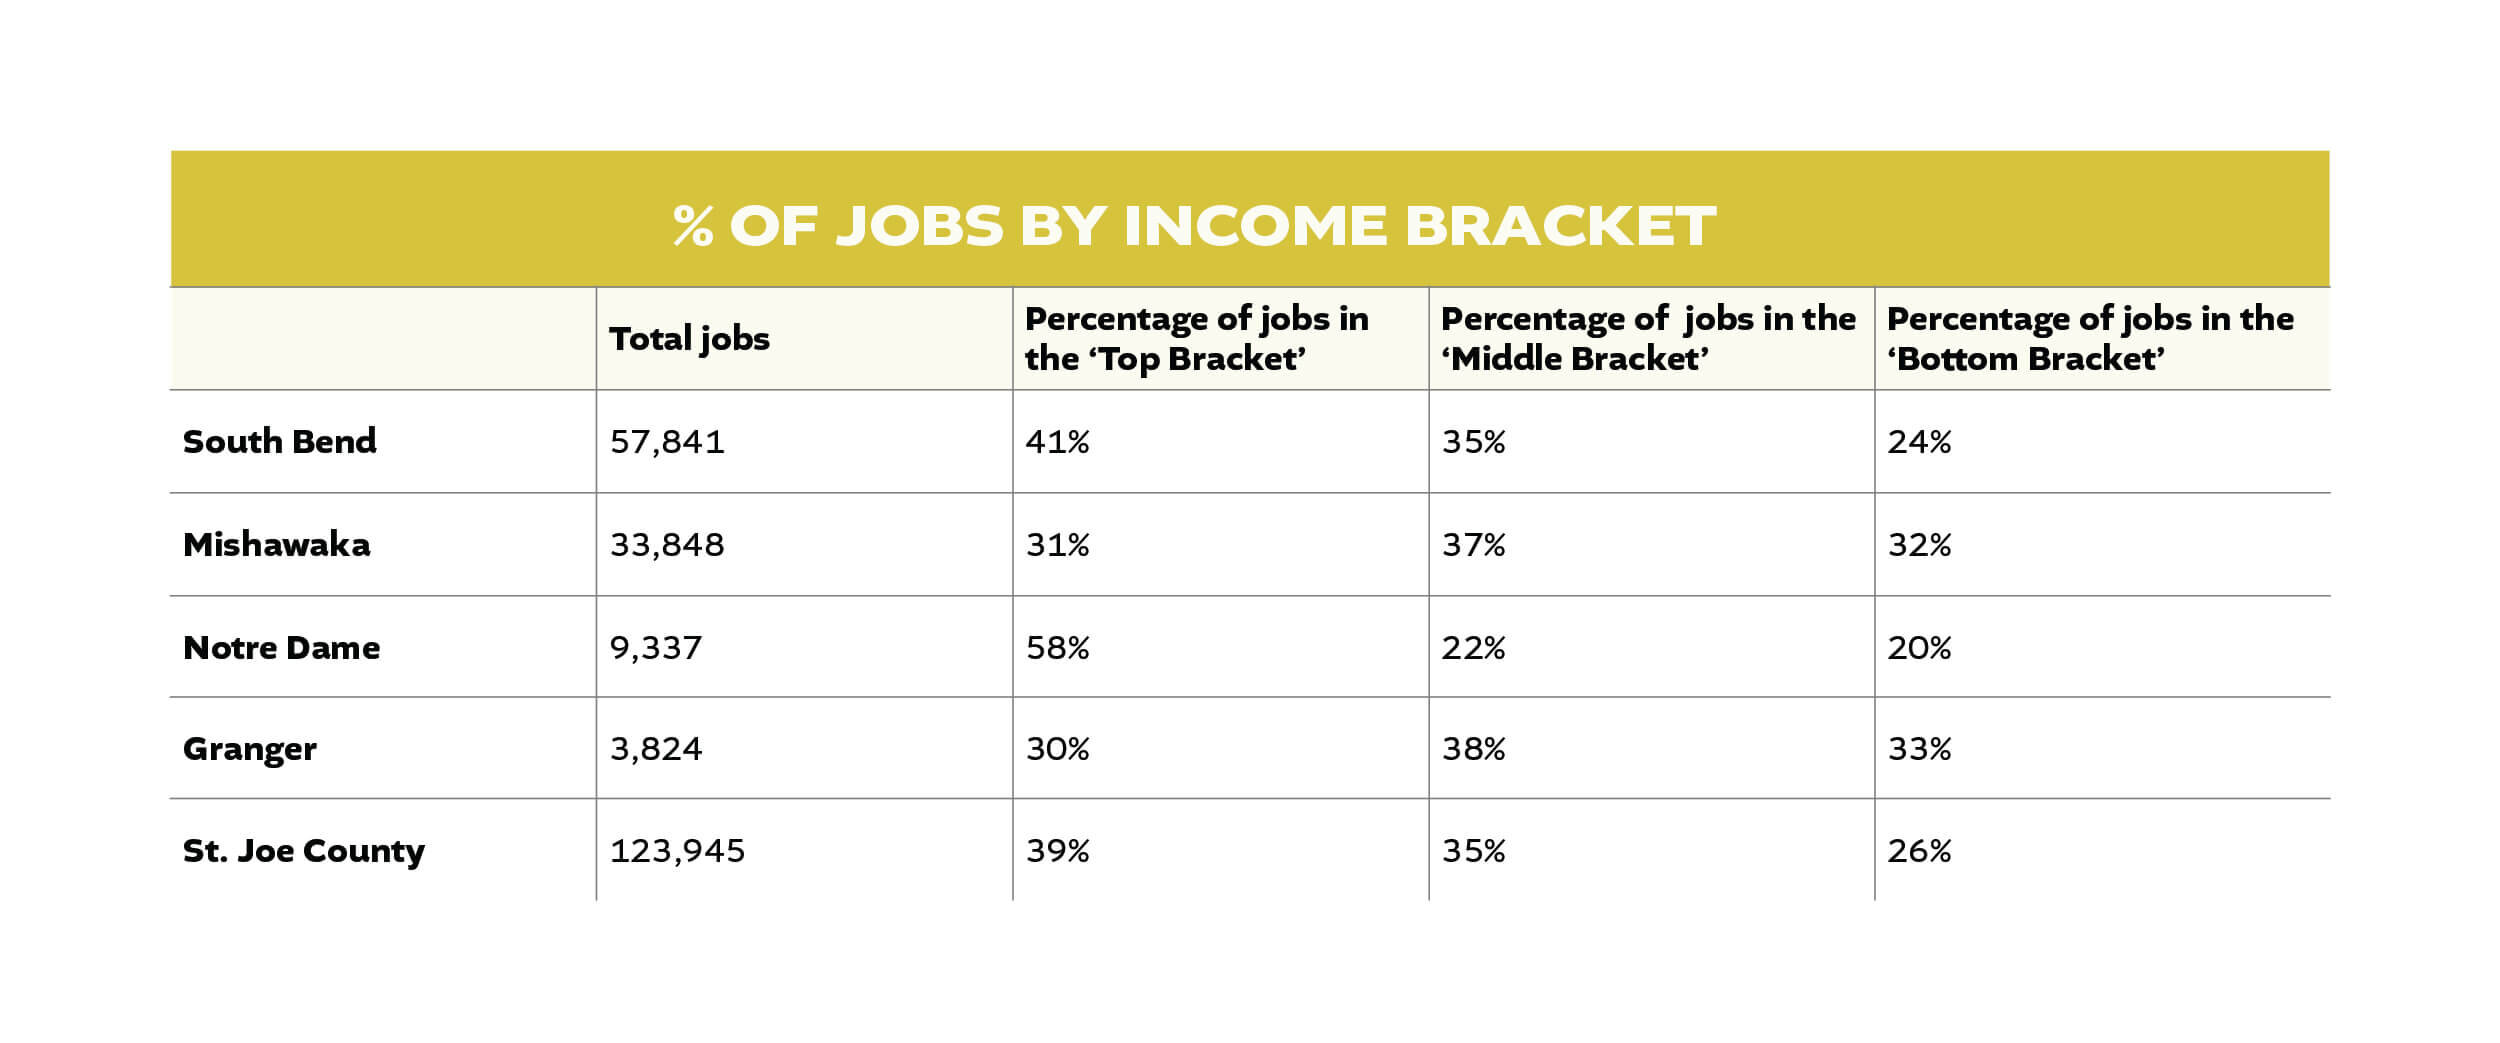
What we find is that the plurality of jobs in South Bend are those in the ‘Top Bracket.’ In fact, the ‘Bottom Bracket’ job category is South Bend’s smallest and only accounts for 24% of all jobs located in South Bend. Compare that to Mishawaka where a full 32% of jobs are in the lowest category, and the county as a whole where ‘Bottom Bracket’ jobs make up 26% of the total. South Bend has roughly half of all ‘Top Bracket’ and ‘Middle Bracket’ jobs in St. Joe County while only 42% of ‘Bottom Bracket’ positions.
As covered in a previous article, Mishawaka avoided population decline through extensive annexations of suburbs in the latter part of the 20th century. Mishawaka, like South Bend, lost over 40% of its manufacturing jobs. Today, a much larger share of jobs in Mishawaka are in the ‘Bottom Bracket’ and a much smaller share are in the ‘Top Bracket’ than in South Bend. If ‘Myth Two’ is to hold water, it must explain how Mishawaka has grown its population while South Bend has failed to do so despite the fact Mishawaka has larger shares of lower-paying jobs.
Remember when looking at the two charts above detailing the type of jobs found in each community that South Bend has the lowest household income and highest poverty rates of all the jurisdictions listed, despite the fact that employers in the city provide a larger share of ‘Top Bracket’ jobs than any other entity.
Another falsehood ‘Myth Two’ describes, is that South Bend is no longer a center for manufacturing. Yes, many of the factories are gone, but 12% – about 7,000 jobs in total – of all jobs in the city are still held in the manufacturing sector. This is compared to the average of 8% for the United States.⁶ Studebaker is gone and the shells of former factories continue to blight the city’s landscape, but that does not mean manufacturing has left the city entirely, even if its imprint shrank.
South Bend has become home to other well-paying fields in the past half-century, which was not the case back when Studebaker was still producing cars. Today, the city has 64% of all the jobs in professional, scientific, and technical services; 62% of all transportation and warehousing positions; and 60% of all information and technology jobs within St. Joe County.⁷ These are three private sectors of the economy which have a range of employment options and usually produce well-paying jobs.
As the County Seat of St. Joseph County, South Bend also leads with 74% of all positions in public administration within our county. Health care and social assistance is the largest employment category in the city limits of South Bend. Here, too, South Bend holds 52% of all health care positions in the county. It is because South Bend leads the county in these high-paying fields that has resulted in the city having a higher percentage of its jobs in the ‘Top Bracket’ compared to other jurisdictions.
Keep in mind South Bend accounts for only 38% of the county’s population and consists of only 9% of the total land. Yet, the job category percentages in the 50%, 60%, and 70% range demonstrate how the region’s good-paying jobs are concentrated within South Bend. The idea that South Bend is poor because it does not have well-paying jobs simply does not match the facts.
The wealth of the entire South Bend Metropolitan Area is built upon the fact that the city of South Bend supplies the region with a steady stream of well-paying jobs. So, why did South Bend lose population? It is not because South Bend fails to offer well-paying jobs, but because people employed in South Bend rarely live here. A full 72% of all people employed in the city of South Bend do not live in the city limits.⁸ Imagine if those numbers were reversed and three out of every four people who held jobs in the city also lived here. Imagine how that would impact poverty rates, household income, or crime rates. It certainly would have stemmed population loss.
Myth Three: South Bend has done nothing to combat deindustrialization and spur job growth.
The final argument we’ll address is the idea that throughout the last half-century, as South Bend lost population, the city did little to cultivate investments in new job creation. There are multiple examples that could be given to refute this myth, but the one with the most dramatic physical manifestation can be seen in the images below taken in 1998 and 2019. This is the far northwest portion of the city, near where the US 31 Bypass crosses the Indiana Toll Road. In both images you can see current day South Bend city limit boundaries. The large buildings built in the past twenty years represent thousands of jobs in logistics, manufacturing, and warehousing, which were created with the aid of city government investments through infrastructure improvements, tax abatements, and other incentives.
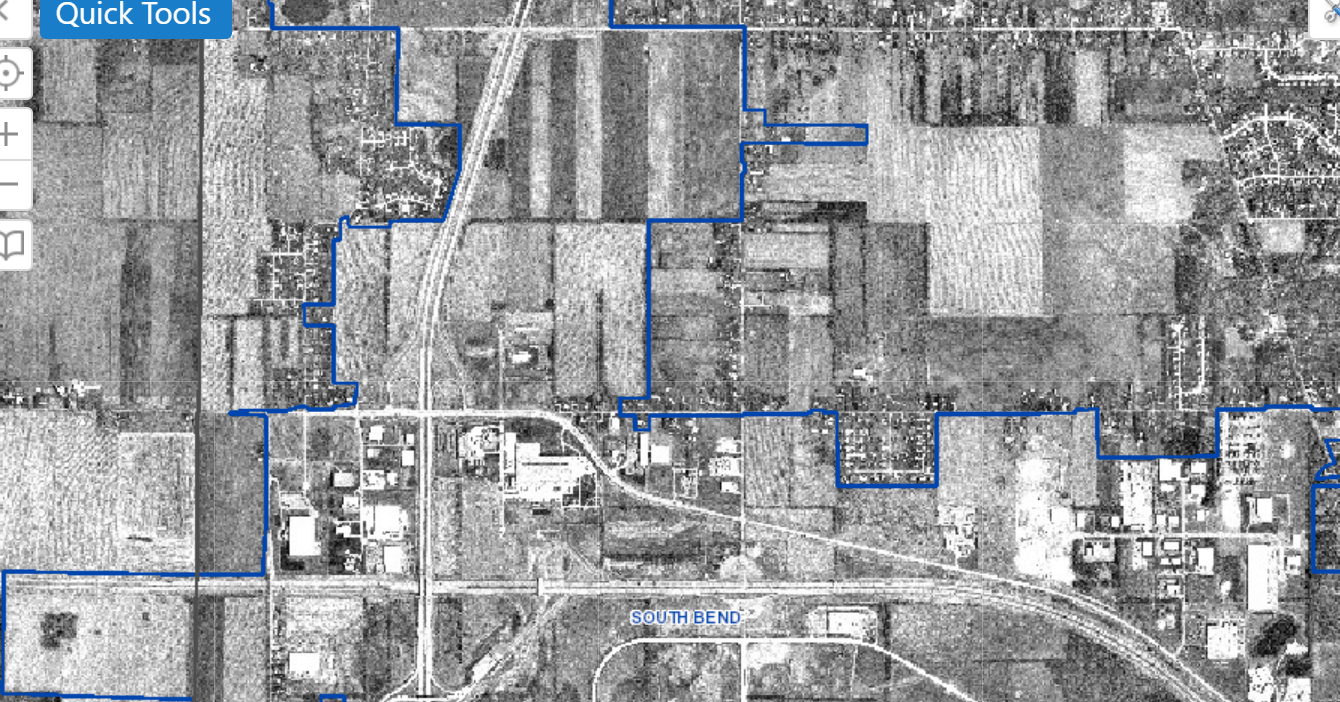
Northwest South Bend with current city boundaries applied, 1998
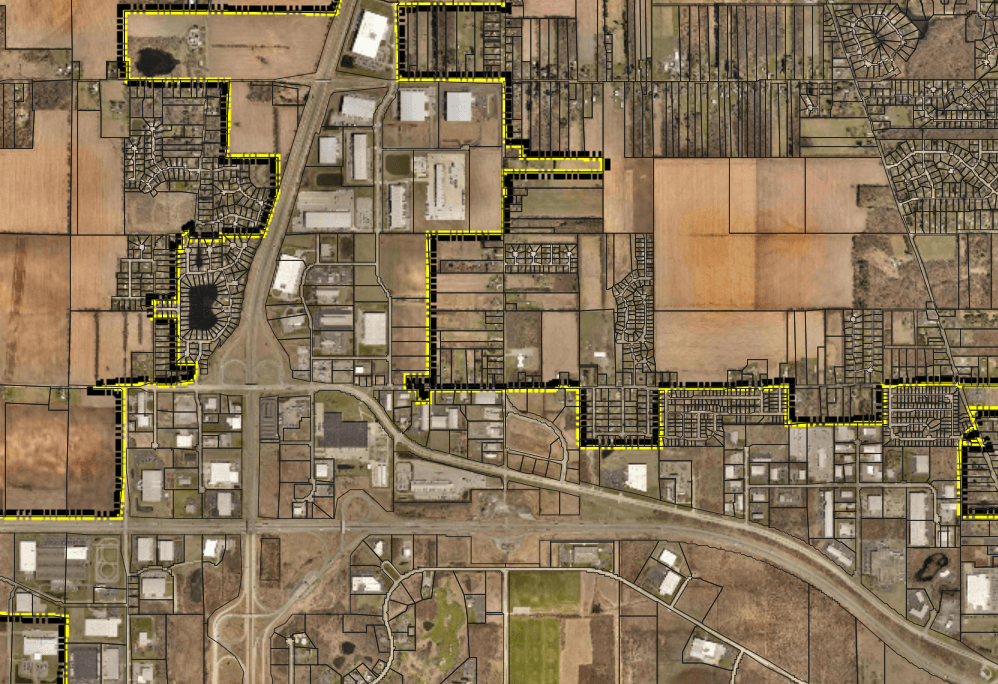
Northwest South Bend, 2019. South Bend has become a leader in the logistics industry, leveraging our prime location leading to rapid growth in warehousing, logistics, and manufacturing in the northwest.
South Bend holds 60% of all logistics jobs in the county, and not by accident. It was a conscious decision by city leaders – both elected, unelected, and community – to invest in this industry. As the COVID-19 pandemic supercharges the need for warehousing and logistics capabilities, the fruits of those earlier decisions will only multiply.
Other examples of city and community efforts to retain and create jobs in South Bend include the creation of Ignition and Innovation Parks which leverages South Bend’s access to a premier university to help generate economic growth. The argument can always be made South Bend could have done more and should have done it faster, but historical and current city actions have positioned South Bend – through multiple administrations –to remain the primary place of employment in St. Joe County even as it was quickly losing its primacy as a place of residence. The city kept many of the jobs, so why did the population decline?
The issue is not with South Bend’s ability to create jobs, but instead the employees of those jobs choosing not to live in South Bend. The labor market between the county and city has become inverted. St. Joe County and the larger “Michiana” area, including Elkhart County and southwestern Michigan, has become a regional job market. If we fail to take this into consideration, we are missing the proverbial forest for its trees. On every single edition of the “More People” series, multiple comments flooded in asking what South Bend was doing to keep up our ‘economic base’ or bring ‘good jobs’ to the area. South Bend has done well generating and retaining jobs, but the benefits are not fully realized if those employees then live outside of the city.
These industries, even if most of the employees do not live in South Bend, still provide benefits to the city. Commercial properties – i.e., anything not residential in nature – can be taxed at a higher rate than residential property due to differential property tax caps enshrined the Indiana Constitution. Even if the law office downtown or the factory on the far northwest side have minimal South Bend residents working in them, the property taxes and increased economic activity which take place because of those locations still benefit the city. This series however is centered on the population history of South Bend and, from a purely population lens, job creation alone is simply not enough.
I am not arguing that jobs are not important to either the economic well-being of the city or the growth or decline in population. What I am saying, however, is that simply adding jobs, or even high-paying jobs, does not necessarily lead to population growth. Job growth is one factor which must be taken into context within the overall concept of population. There is a culture in St. Joe County – which is reflected in most of the United States – that if you make good money, the best bet is to move out to the suburbs. Granger and the unincorporated areas of St. Joe County grew in population throughout the 20th century not because of a large growth of jobs in these areas, but because they were billed and perceived as great places to live. The inverse is true as well. South Bend lost population because people no longer wished to live in South Bend due to a host of reasons yet to be evaluated, not because they no longer worked in the city.
South Bend is a poor city, true, but South Bend continues to generate a tremendous amount of wealth within its borders. Therefore, the very topic of population decrease is important to analyze, discuss, and understand. The decline South Bend experienced was not experienced throughout the entire region.
The biggest reason this topic warrants such deep scrutiny and why we must debunk our perceived notions of why the city has suffered population decline is because where people reside, work, and generally live their lives matter.
• • •
This article is meant to properly frame the suburbanization/annexation discussion which will come next. I felt this article was necessary not because it explains how South Bend’s population declined, but because it addresses some of the common assumptions as to why. This is the first article to tackle the general argument of why population decline is important. I can’t say for certain how many more articles will be written, but thank you for continuing to read. It has been a joy and an honor to help discuss these topics with a range of individuals who care about South Bend, both those who have agreed and disagreed with my analysis. I am certainly aware that I may be missing parts of the story. If you feel that I am, please reach out to me. Let’s talk.