More People: A Trend Breaking Decade for South Bend

This is part of an article and podcast series by Joe Molnar titled More People: How South Bend Lost 50,000 People in 50 Years. Joe is a proud 4th generation son of South Bend.
Read the original series: Introduction | One | Two | Three | Four | Five | Six | Seven
Read the census recap: Introduction | One | Two
Subscribe to the podcast: Apple | Spotify | Google | Stitcher | TuneIn
The dust is settling from the release of the 2020 Census results. More People chronicled the fifty-year collapse of population in South Bend. One good report - and as we will see, it was indeed a good report - does not erase nor invalidate the contraction which preceded it. South Bend is still a city of vacant lots where homes should stand, where half-filled classrooms are the norm in schools, and where the negative impacts of population collapse are readily seen and felt by residents. Nearly every issue identified in More People still plagues South Bend today.
Yet, what the 2020 Census did identify is that the tide has turned, or at least that we can begin to truly believe that South Bend’s next fifty years will not look like her last. On nearly every front, the Census shows that the issues identified in More People have improved during the 2010s.
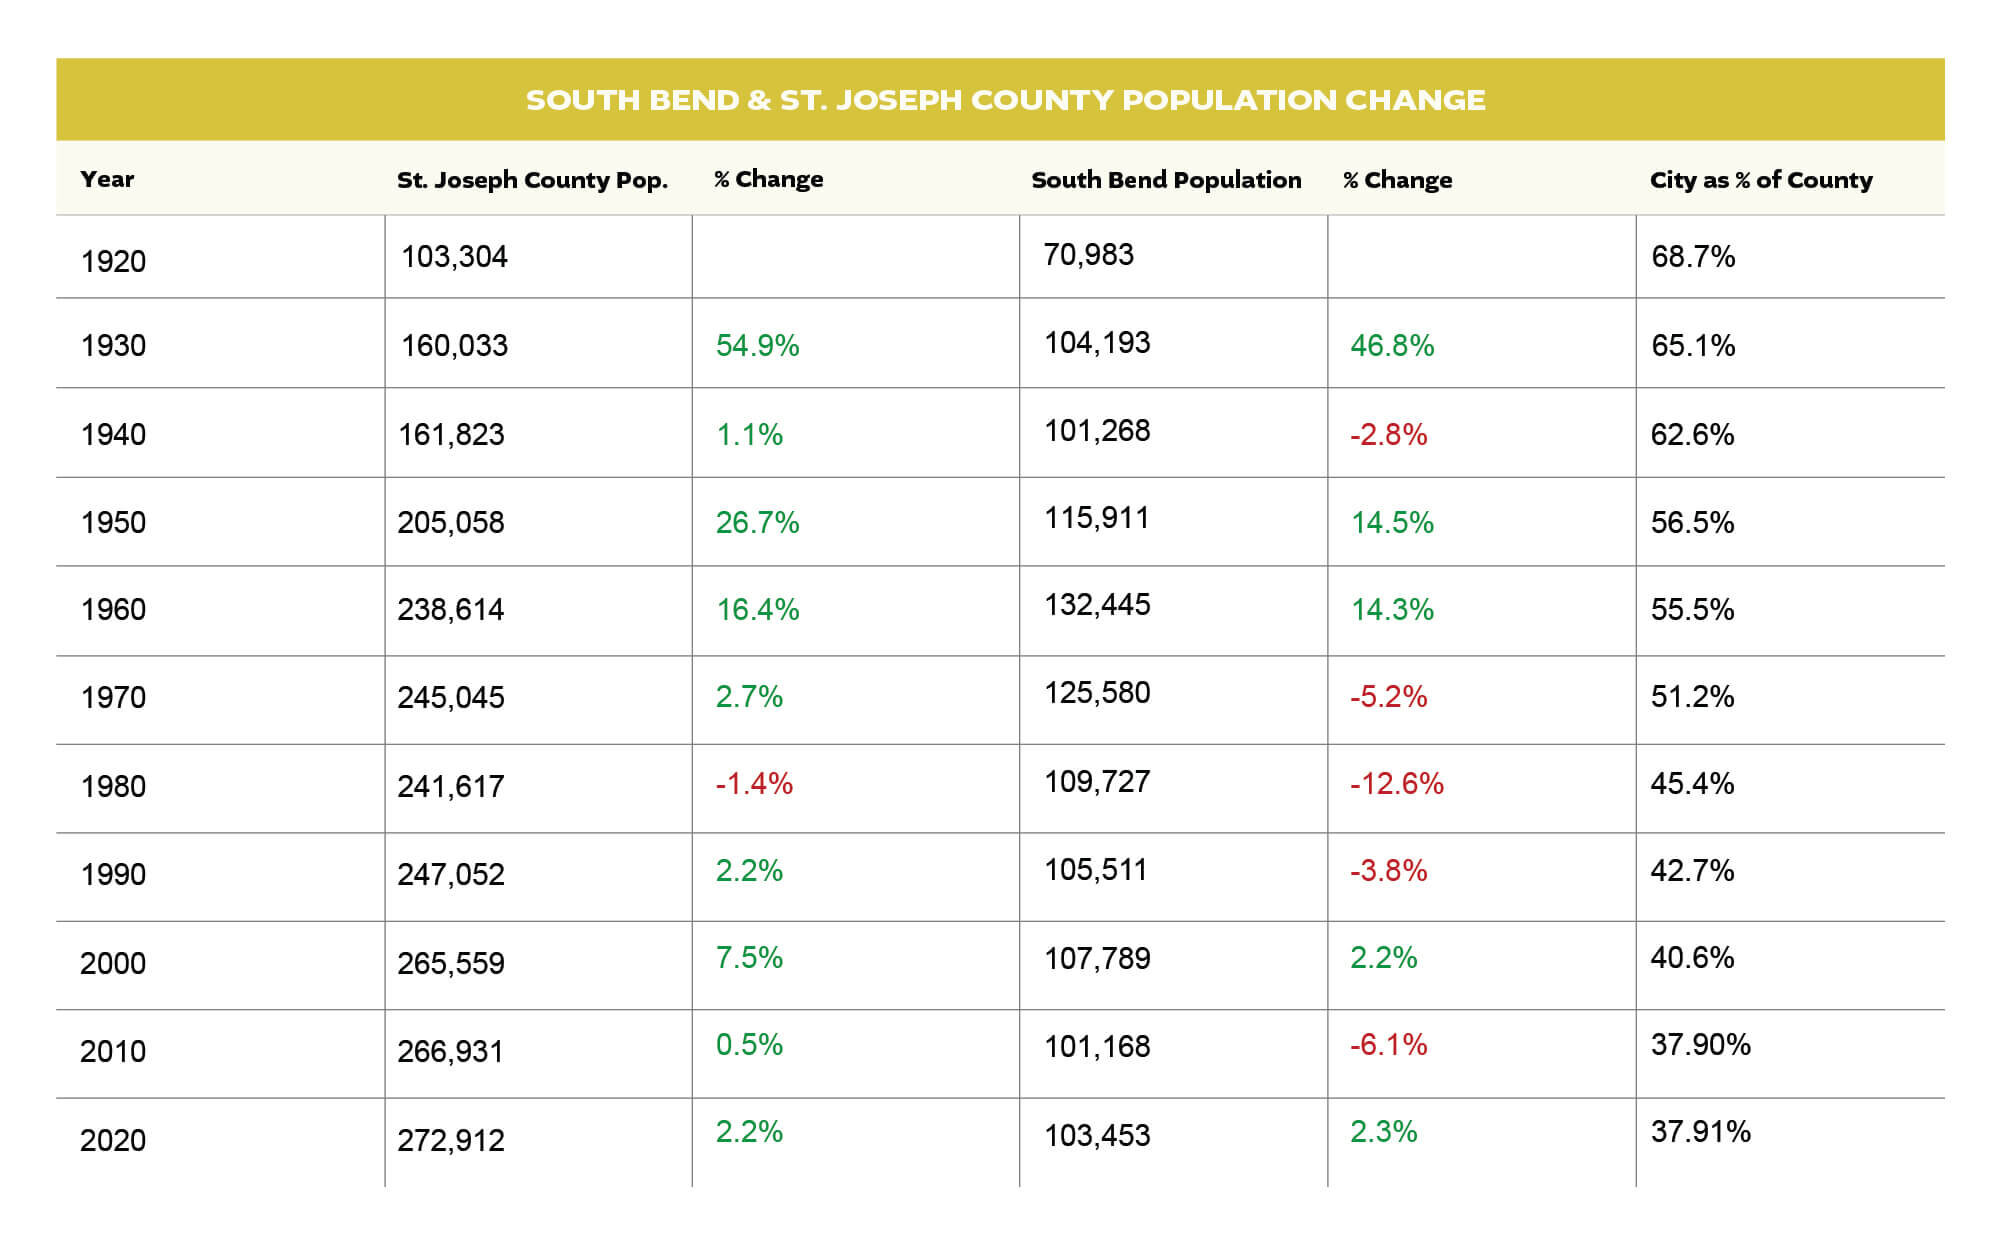
South Bend saw its fastest growth since the 1950s. For the first time in a century, the City of South Bend grew faster than St. Joseph County as a whole. The unincorporated suburbs of South Bend, which boomed for the past century at an average growth rate of 25% per decade, grew by just 0.75%, or one-third that of South Bend.
For a Rust Belt city, South Bend grew at a healthy pace during the 2010s. Generally, the growth did not come from developing farm fields at the outer edges of South Bend but rather from neighborhoods already in the city in 1960. These core neighborhoods of South Bend - while still down tens of thousands of people from their peak population - gained new residents for the first time in decades.
For a century, South Bend has shrunk from the inside out while the outer edges of the metro area grew. That trend began to shift in the 2010s. No one can say with confidence this will continue into the 2020s but what we can do now is look with a discerning eye at what happened in the past decade.
The Census releases a lot of data, and it has taken time to make sense of that data and what it means for South Bend. Like the original More People series, this epilogue will consist of a few separate articles focusing on one aspect of the changes that occurred during the past decade. Our first part will attempt to put the growth South Bend experienced into context with its past.
Fastest Growth in Generations
South Bend’s population growth of 2,267 may not seem very impressive on its own. South Bend’s 2.3% population increase lagged behind both the growth rate of the United States (7.4%) and Indiana (4.7%). From this lens, the 2020 Census demonstrates that South Bend is still a slow-growing city in a slow-growing region. However, when you look at South Bend’s past, you see why this growth was better than an initial glance would dictate.
South Bend’s growth in population was the fastest it has seen since the 1950s. It was only the second time South Bend has grown at all since the mid-20th Century. That simple fact alone is notable. Only twice in seven decades did the city grow at all; the norm was to lose thousands of people.
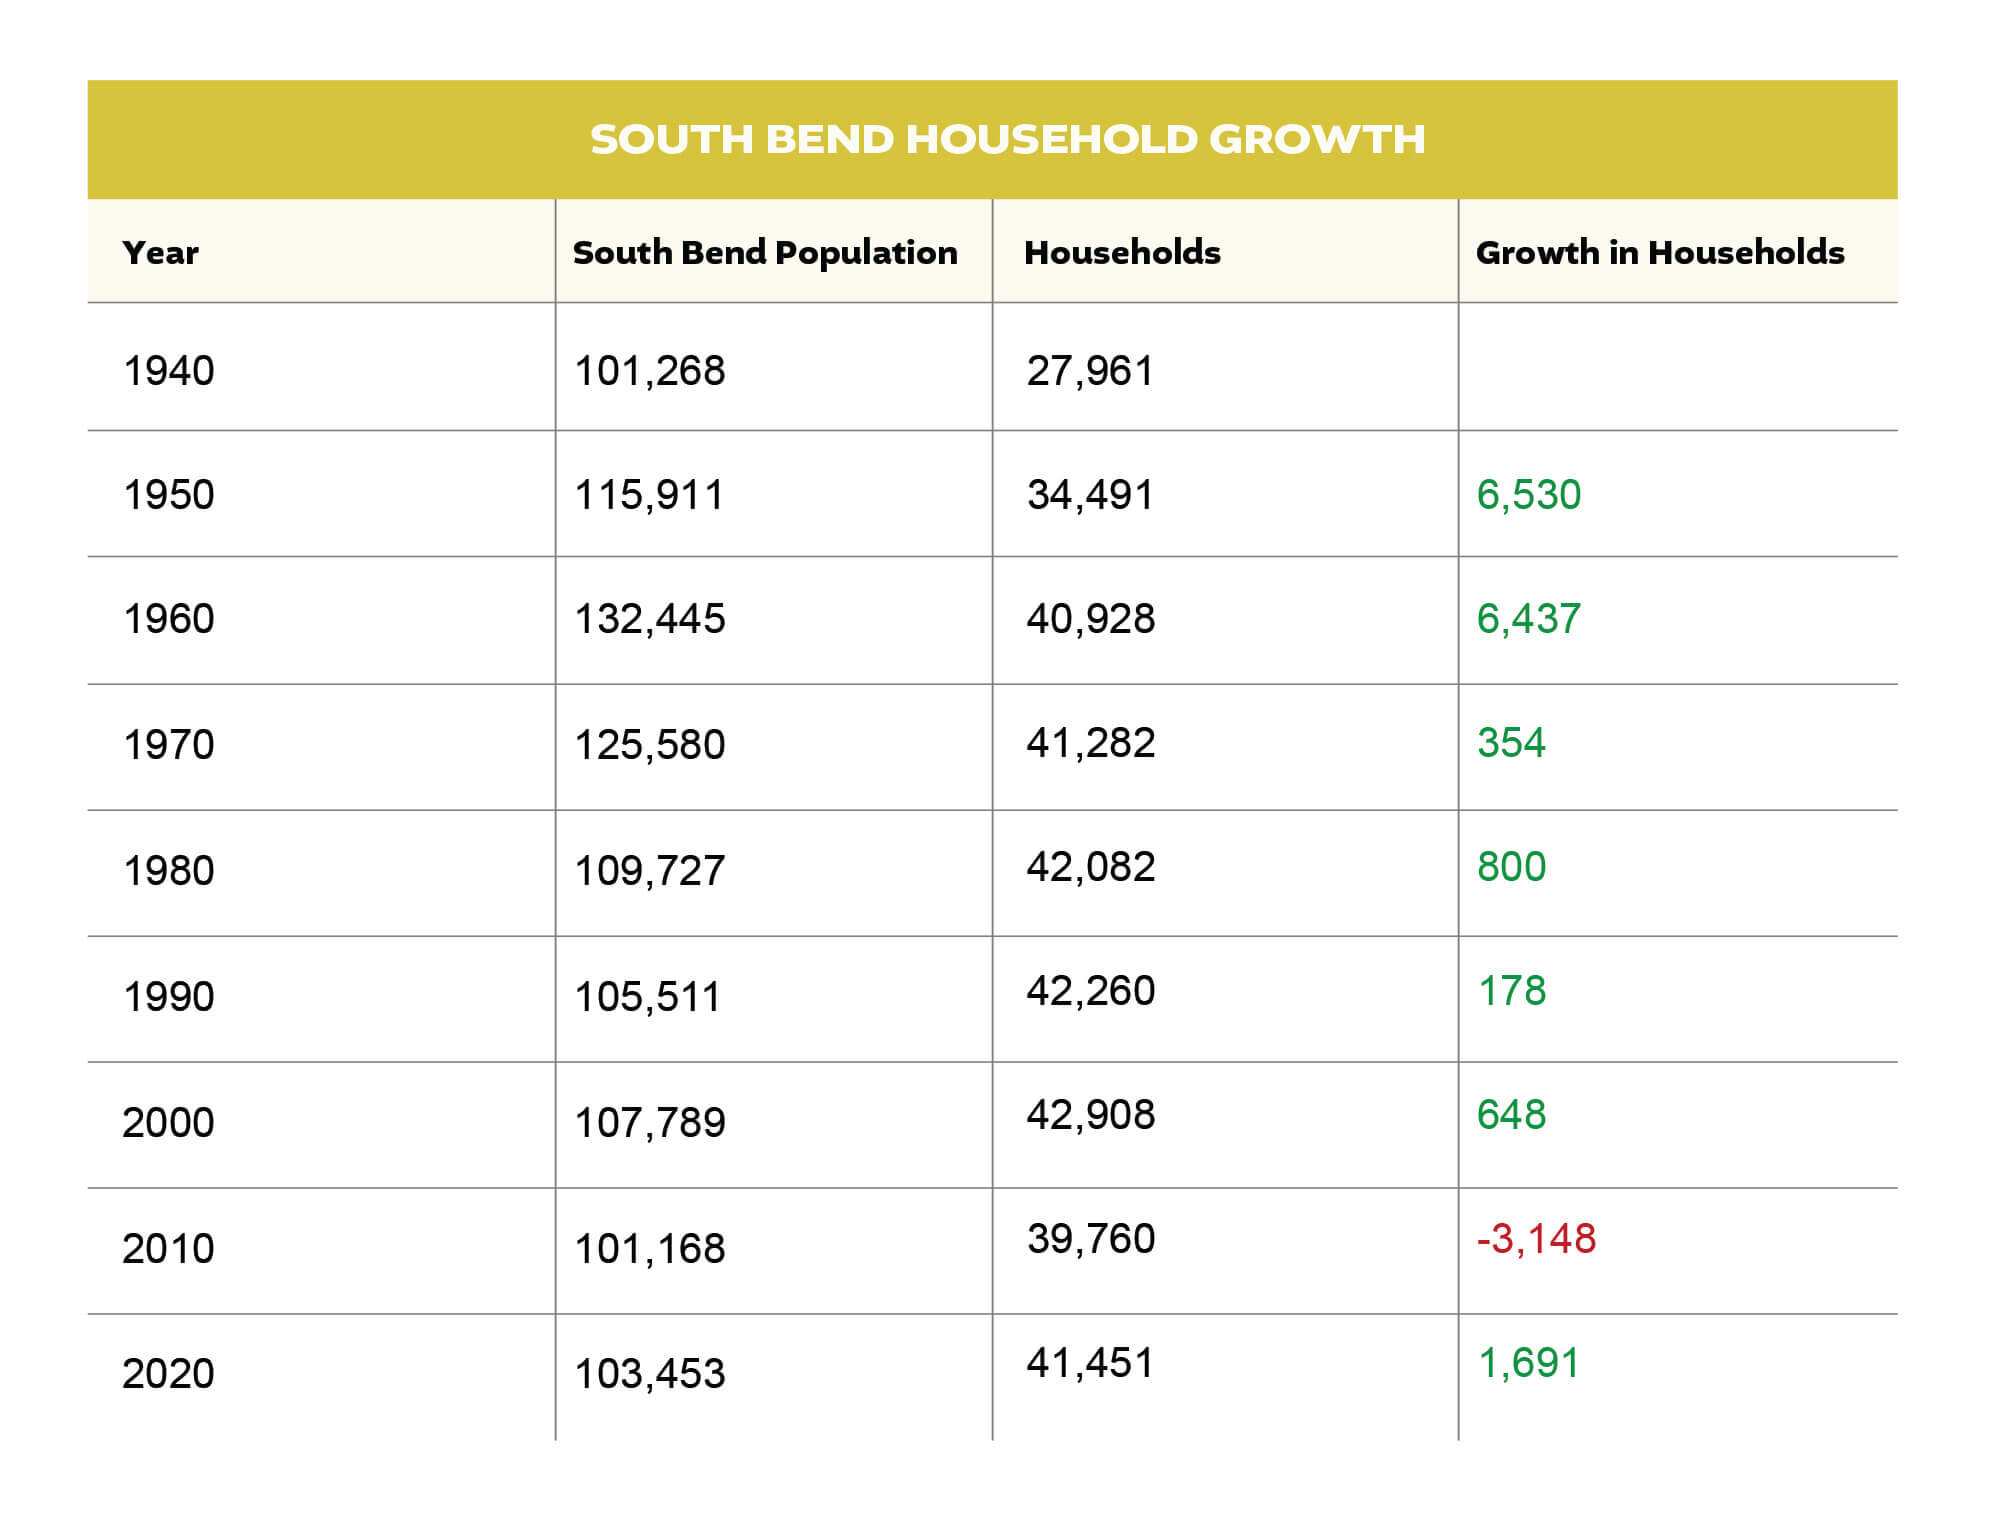
As we explored in More People, however, much of South Bend’s decline in population was not because households were fleeing the city but because each household began to be made up of fewer people as generation after generation had fewer children. During the 1960s and 1970s, when South Bend lost thousands of people, the number of households in the city ticked up. South Bend’s biggest problem was all the new households were outside of the City limits.
During the 2010s, South Bend grew its number of households by 1,691 or 4.3%—nearly double its population growth of 2.3%. As has happened time and again, households in South Bend became smaller, but this time the number of households grew fast enough to mitigate that decline. Almost as important, the 2000s remain the only decade in history that South Bend lost households.
Against South Bend’s past, the 2010s were the best decade since the 1950s in several ways. But what about in the context of South Bend as a part of St. Joseph County? In that respect, it was the best decade in a century.
Urban Growth; Suburban Stagnation
1920 was the high point of South Bend’s share of the total St. Joseph County population. In the following one hundred years, that share has fallen from 68.7% to 37.9%. In simple terms, two out of every three people in St. Joseph County used to live in South Bend. Now that ratio has fallen to one out of every three. The County - which has grown slowly since the middle of the 20th Century - has sprawled further and further into South Bend’s formerly farm field hinterland. Massive subdivisions have sprung up in Clay Township and in Granger while the inner core of South Bend shrank—this was the pattern for a century.
That changed in the 2010s. While it was a very slight uptick, for the first time in a century, the share of St. Joseph County residents living in South Bend increased. The city grew faster than the suburbs—in stark contrast to the last time South Bend gained in population, the 1990s. During that decade, South Bend grew by 2.2%, while St. Joseph County as a whole grew by 7.5%. In many ways, which we will explore below, South Bend’s 1990s growth was somewhat of a mirage. A fast-expanding overall county was bouying up the city. This time, the urban areas of South Bend and Mishawaka accounted for nearly all of the growth in St. Joseph County. If you take out the cities of South Bend and Mishawaka and the census tract containing the University of Notre Dame, St. Joseph County lost residents. The urban areas are now pulling up the entire county.
Nothing symbolizes this more than looking at the population of Granger. Over the past forty years, Granger has grown into the premier suburb of the South Bend metro by building upon a quality school system and new suburban-style subdivisions. The Census Designated Place grew from a small village based upon a highway intersection into a sprawling suburb of thirty thousand people. However, just like the City of South Bend experienced in the latter half of the 20th Century, Granger is now facing the pressure of shrinking household sizes. As properties have aged and transitioned to second and third-generation owners, each subsequent family is typically smaller than the one before. For the first time on record, Granger shrank. Not a huge loss by any means, but most likely an indication that Granger has reached full build-out with little space to continue growing in population without becoming more dense, a doubtful proposition.
If anything, this is the most important takeaway from the 2020 Census for our area. South Bend’s growth was welcome, but South Bend growing while the surrounding suburbs lost population is something not seen in any living person’s lifetime.
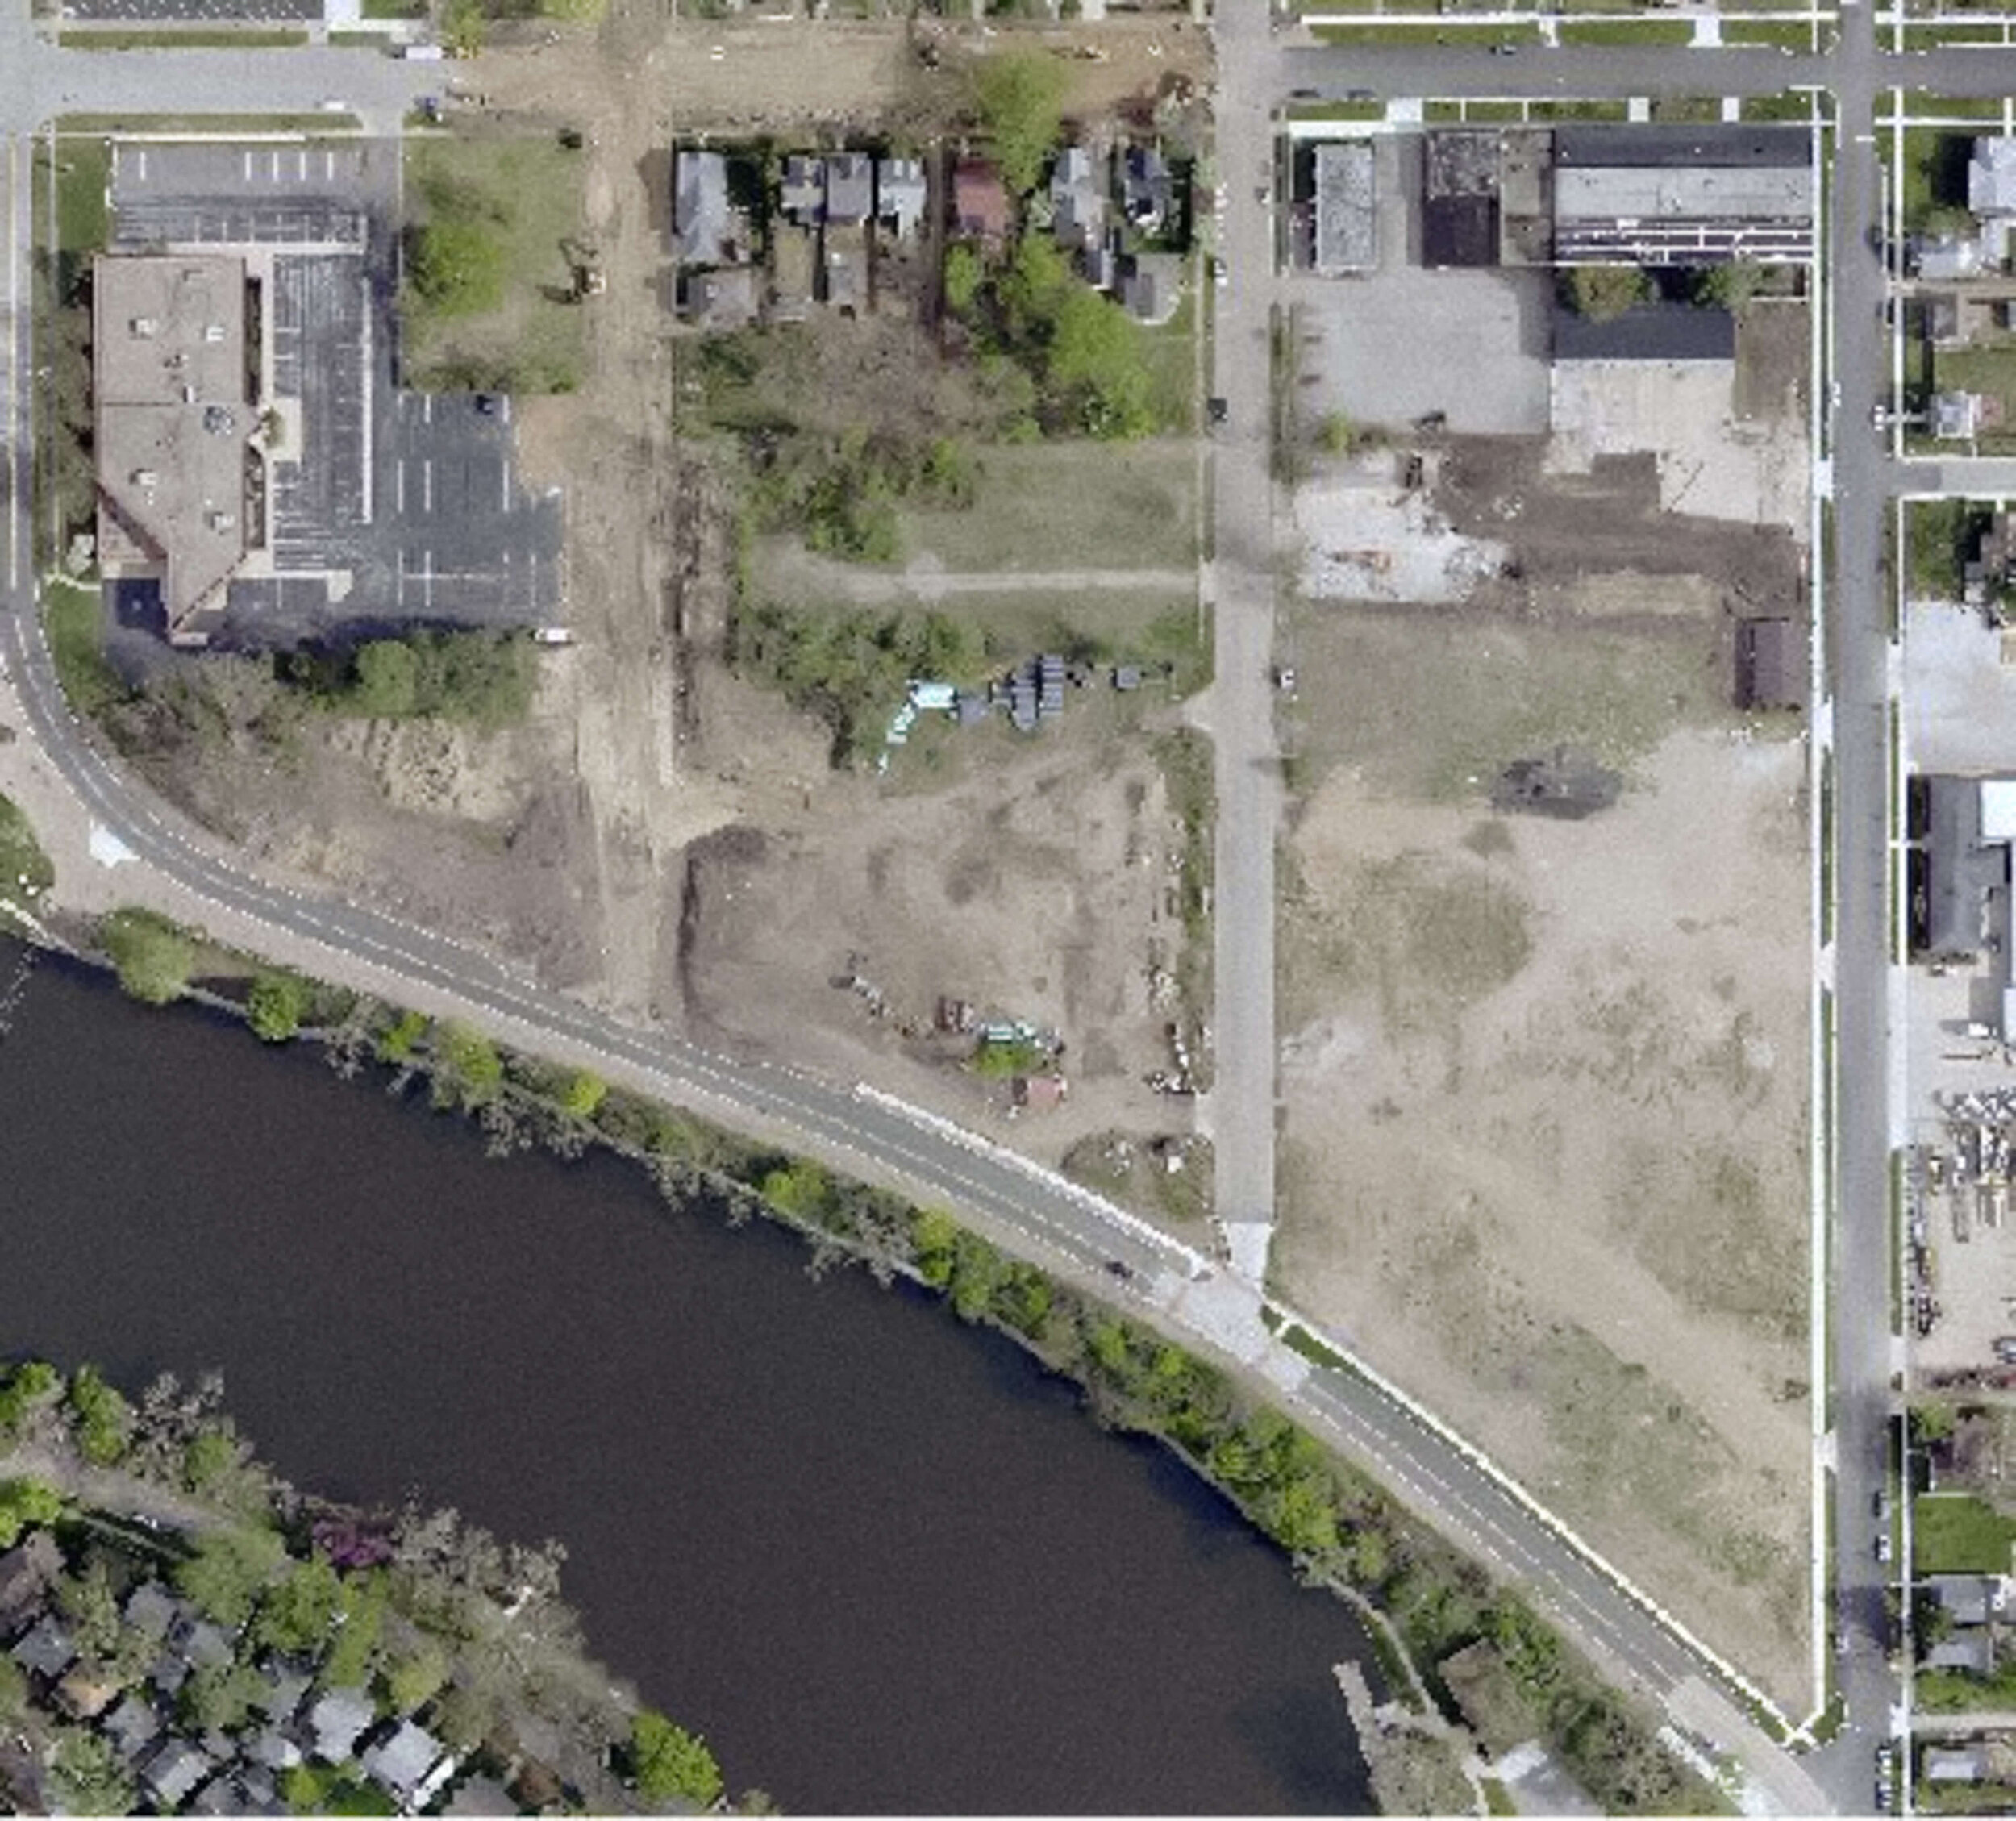
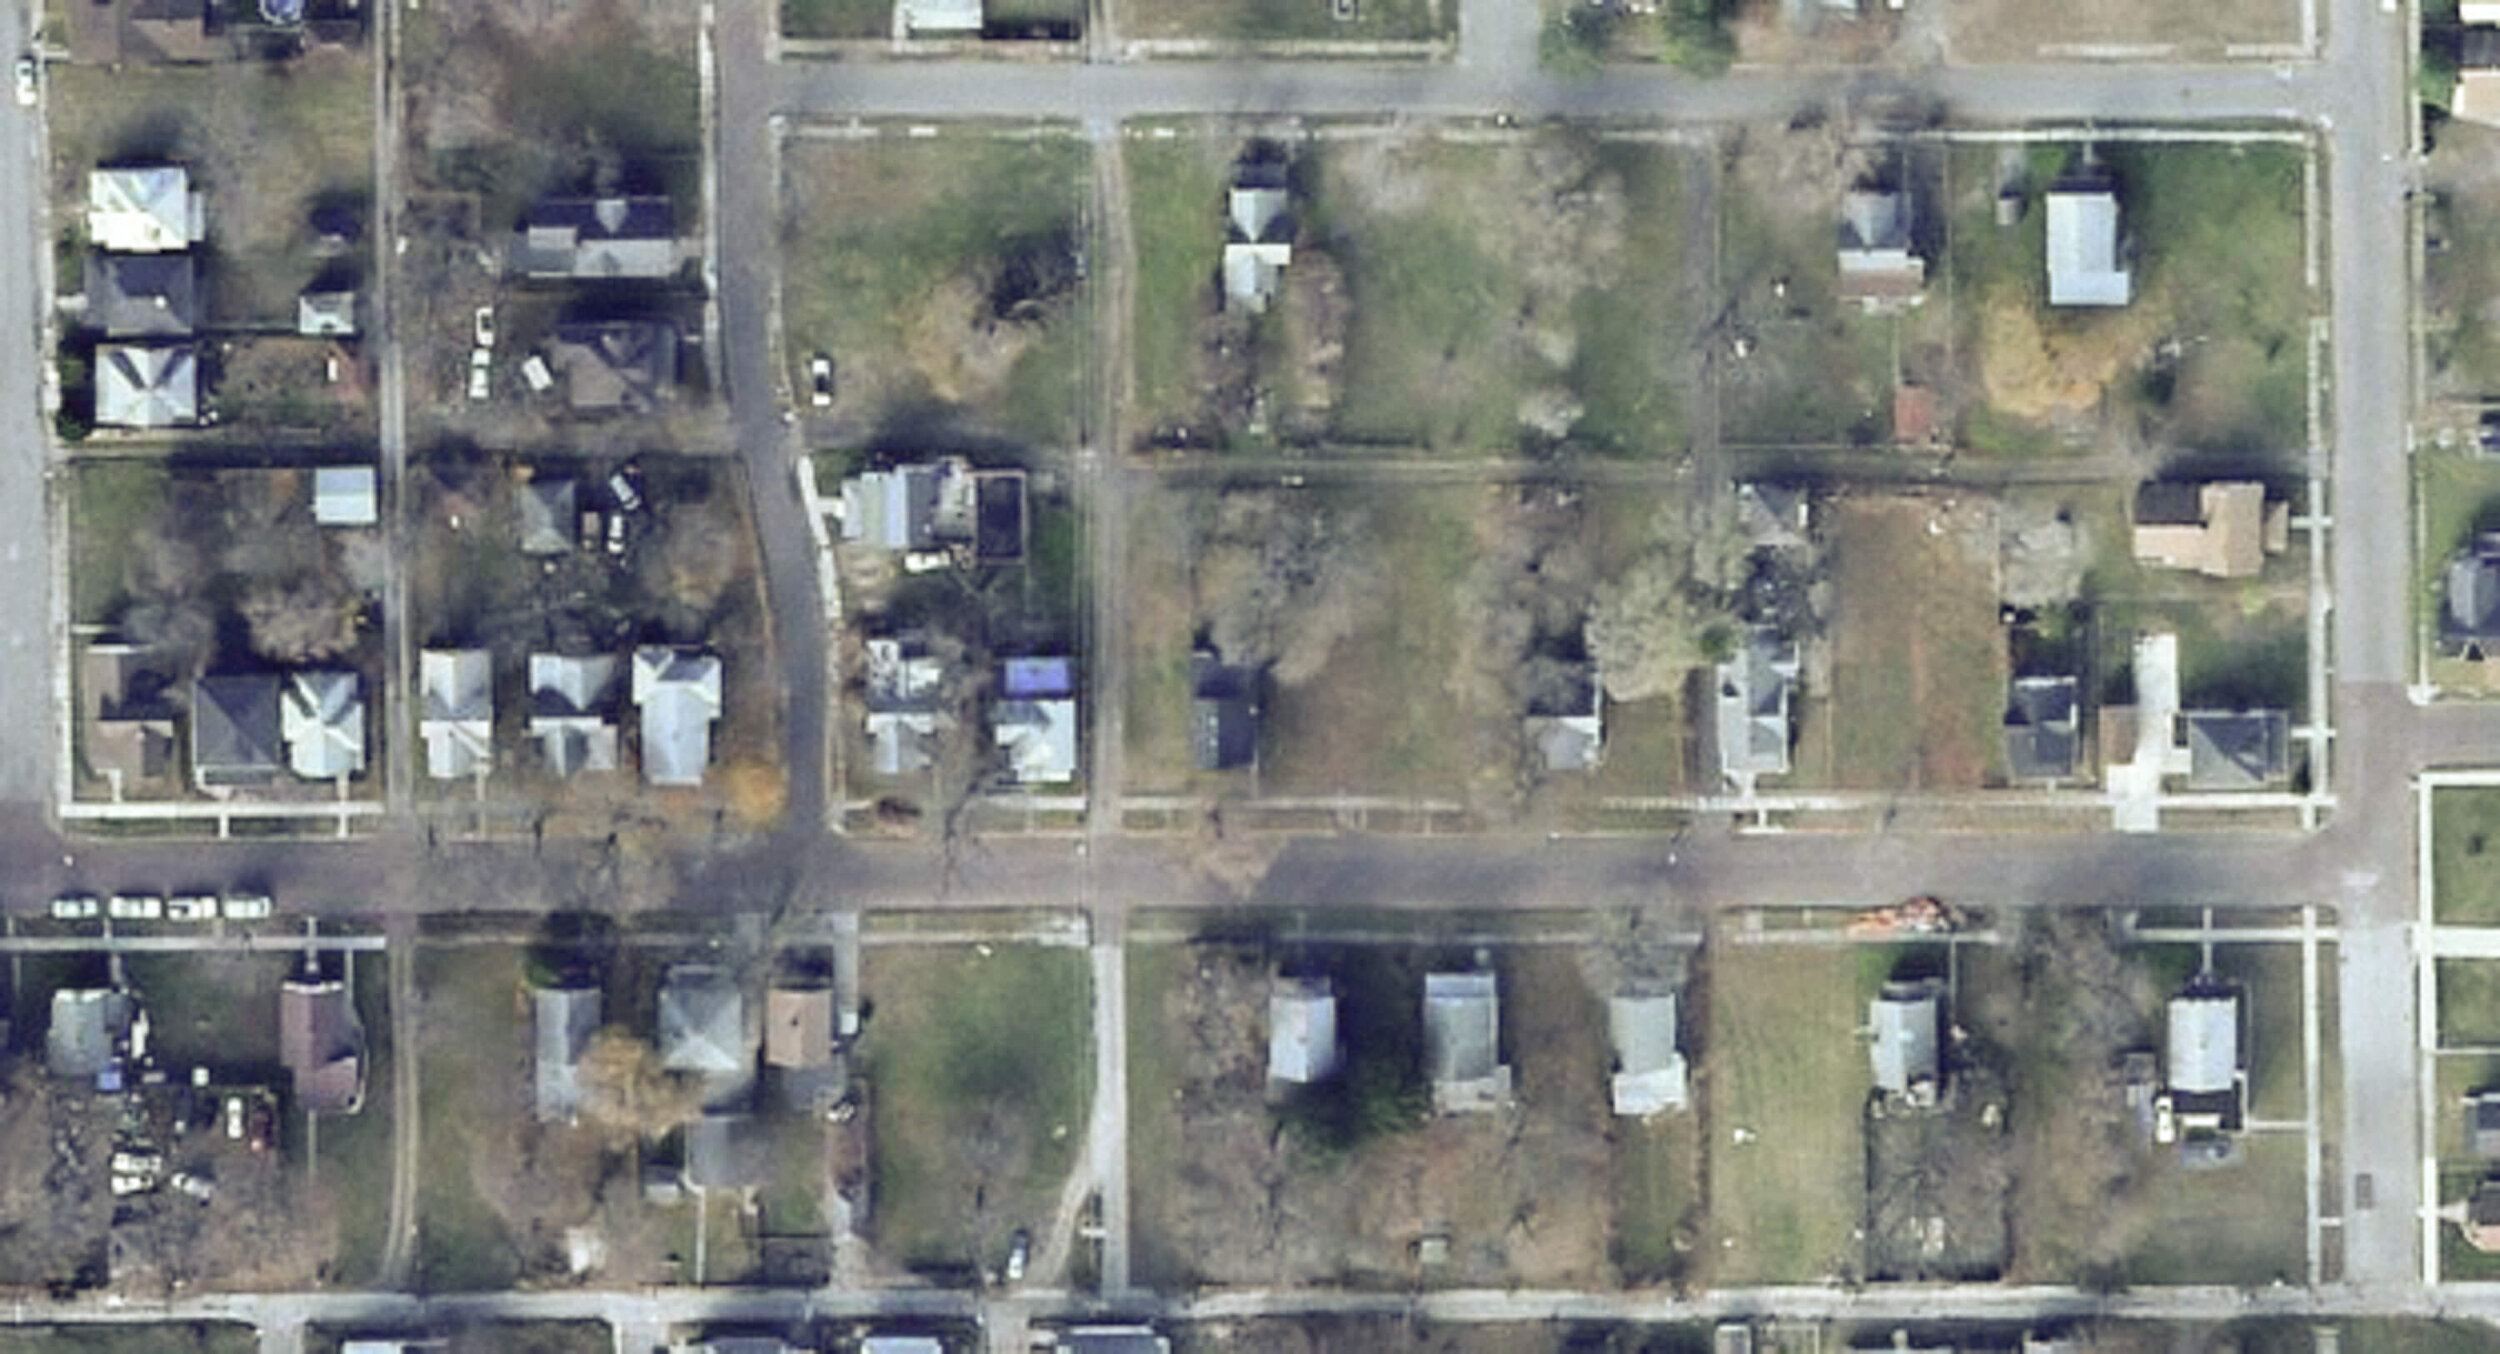
Residential growth in the urban core of South Bend in the East Bank neighborhood.
Broad Growth and a Denser City
The last piece of data we will look at to demonstrate the trend-breaking aspect of this Census is how broad-based the growth was across the city. South Bend comprises thirty-five census tracts, which conform to the 1960 city limits. Of those thirty-five tracts, twenty-two grew, and two others declined by less than five people. In 2010, just seven census tracts grew.
Next time, we will look at exactly where this growth occurred, and the answers may surprise some people. But at a high level, we can see some more details which, once again, break long-standing trends. Below you can see a map with the current city limits outlined in yellow with the approximate 1960 city limits outlined in red.
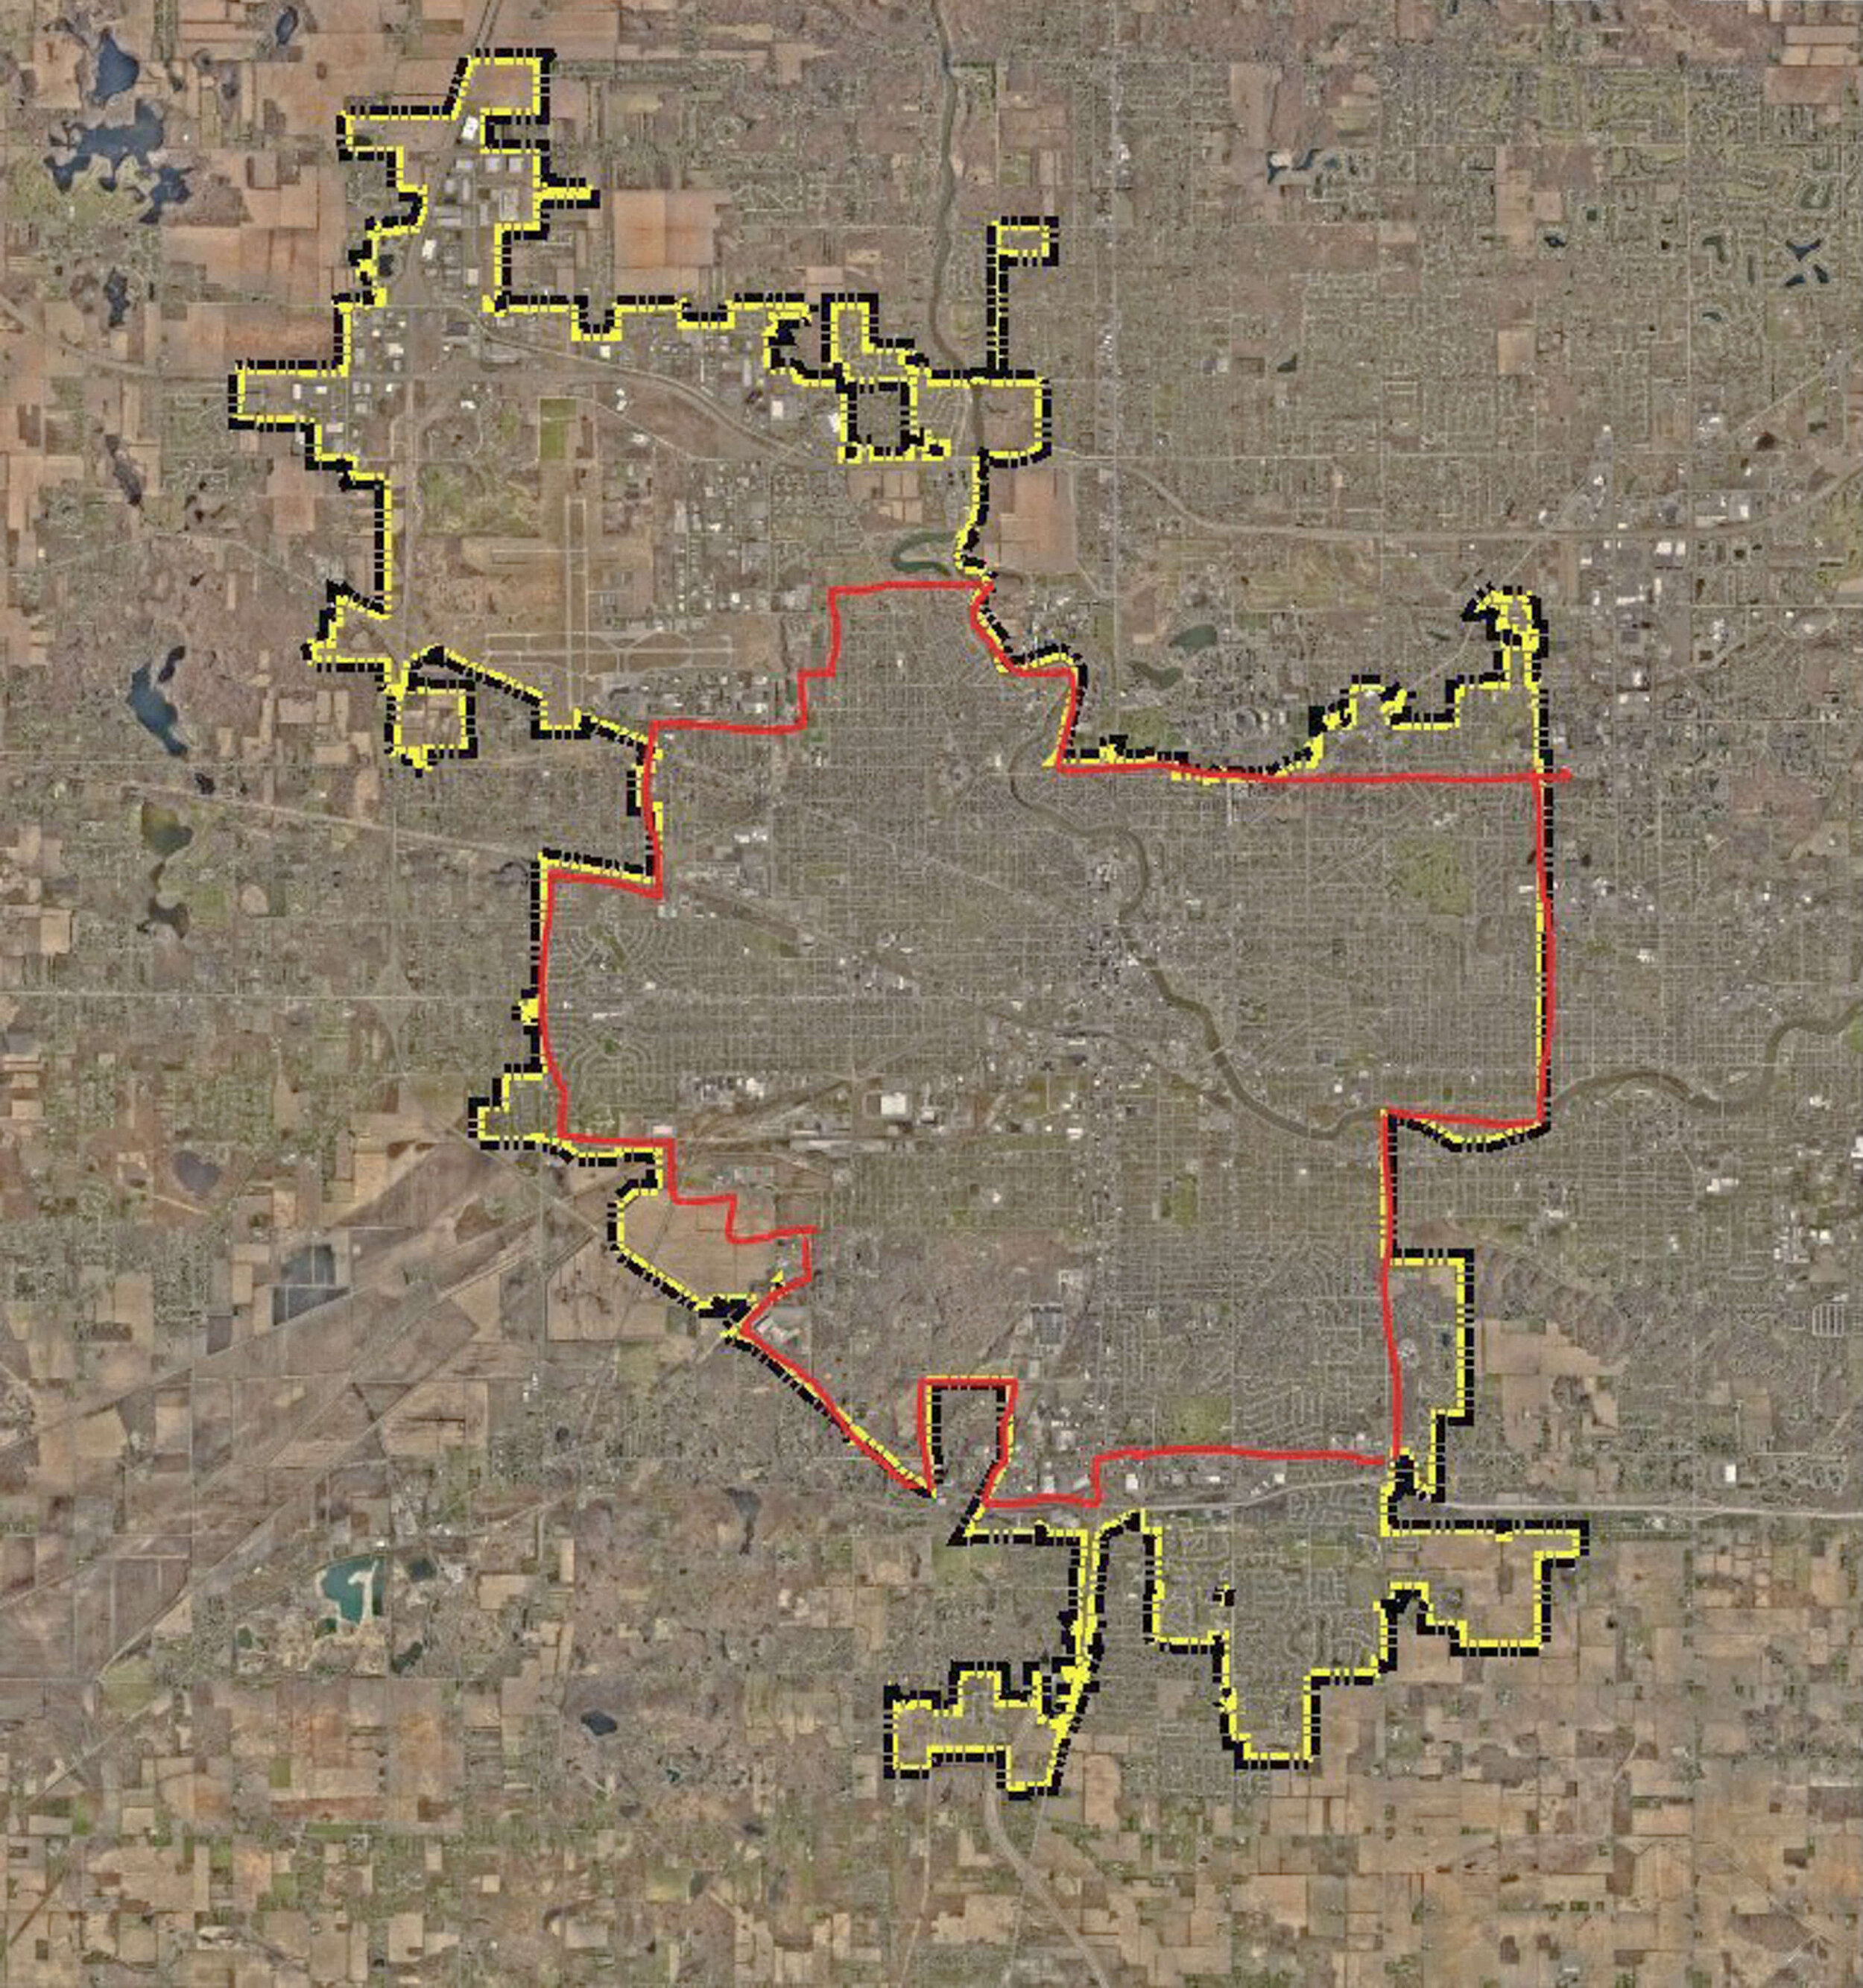
For six straight decades, the area inside the 1960 city limits continued to hemorrhage people while annexations elsewhere were not enough to make up for that decline. The 2020 Census found that South Bend grew both inside and outside of the 1960 city limits.
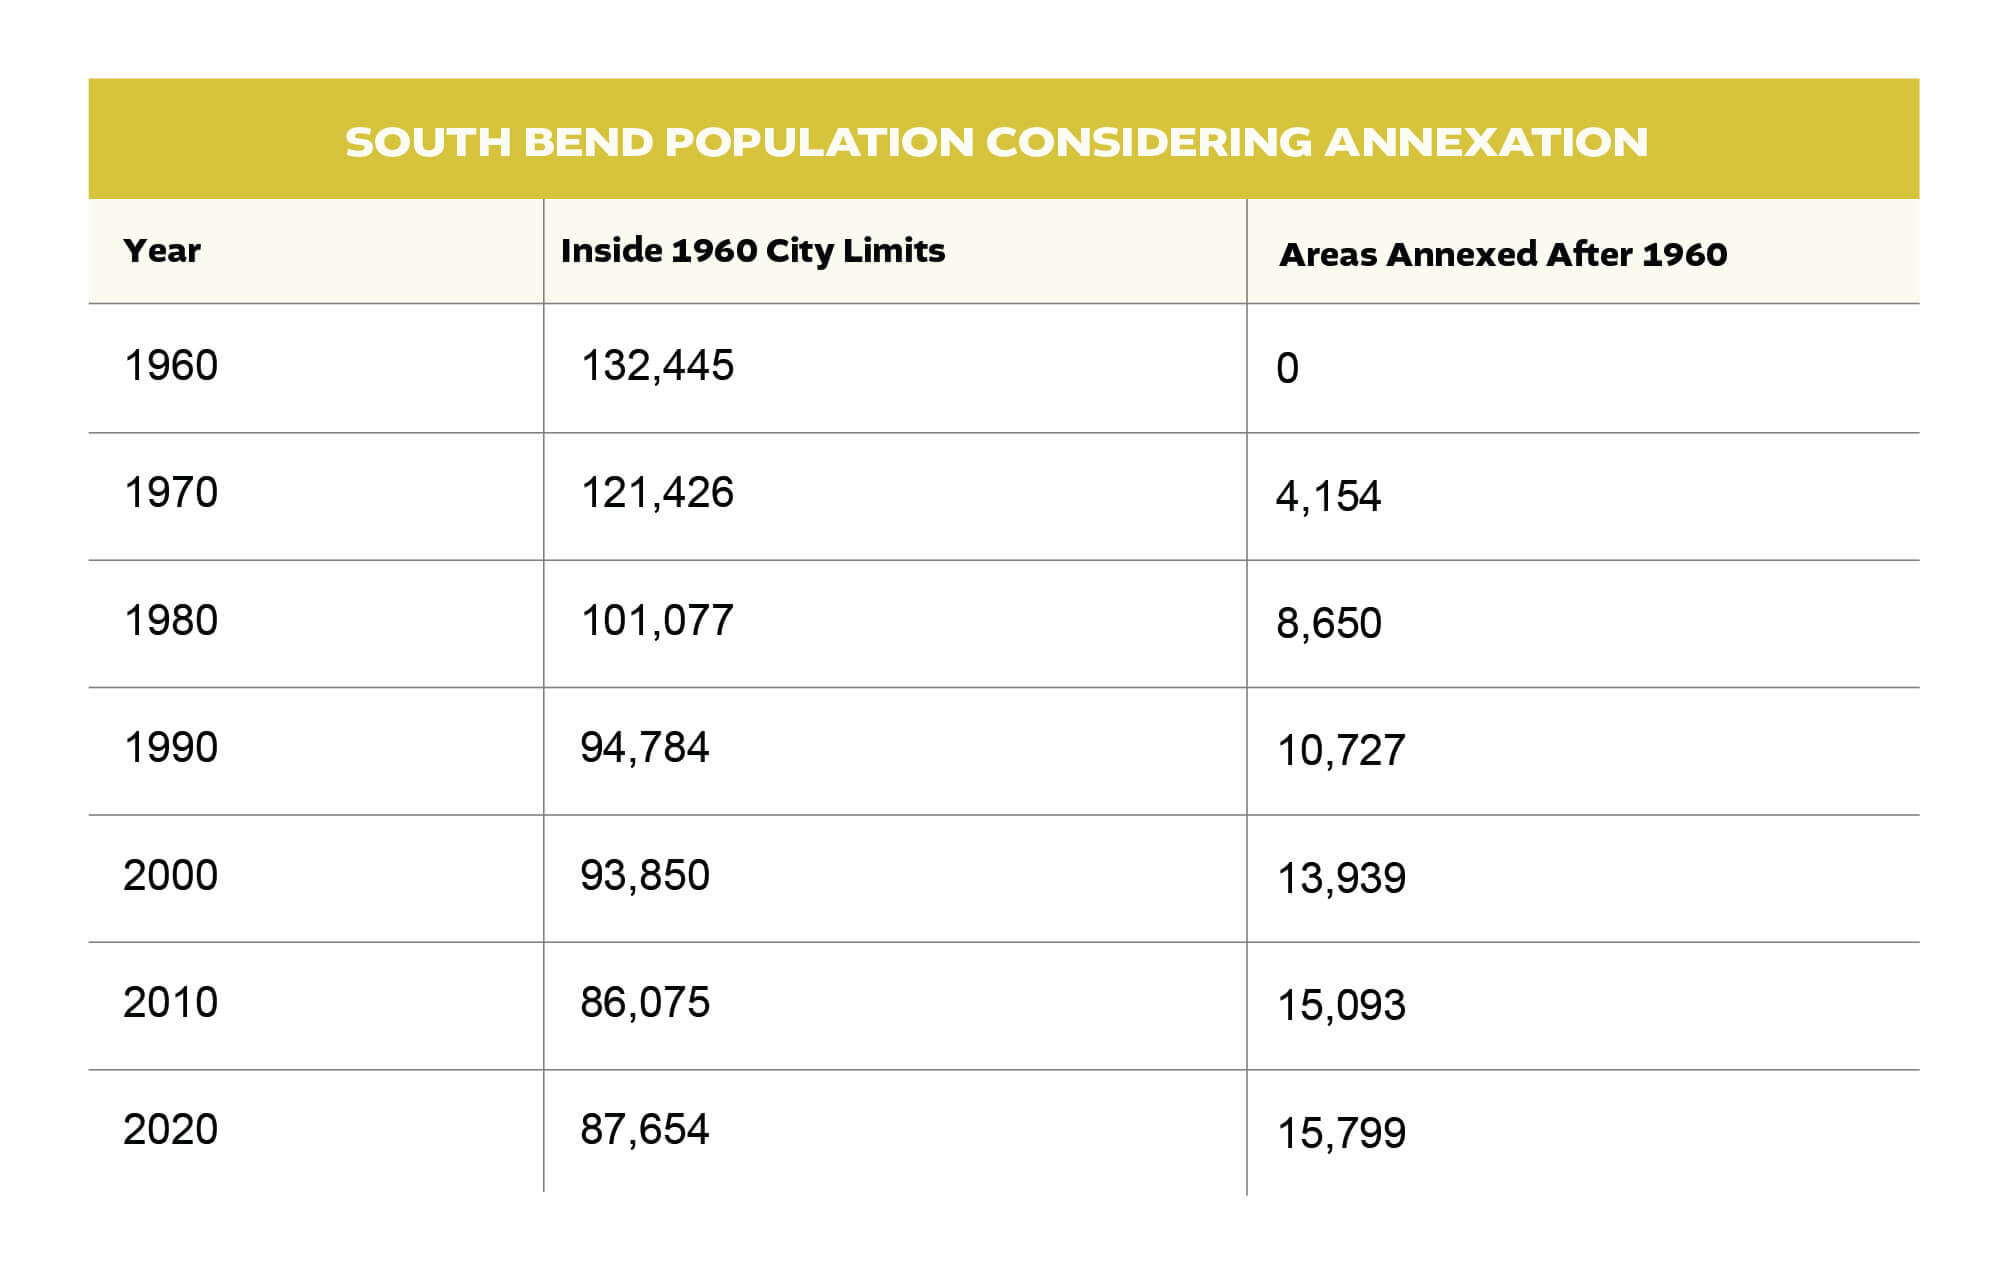
For the first time since 1960 - and yes, that’s been the theme of this first part - the “historic” South Bend grew in population. As city policy has shifted and annexation became difficult, the growth outside of historic South Bend was minimal—a similar pattern to the past two decades.
On yet another level, long-standing trends broke in the 2010s: South Bend grew its population, in part, by increasing infill development in the city core.
This growth increased the density of South Bend. Since the City annexed almost no residential land over the past decade, all of this residential population growth occurred on land already in South Bend in 2010.
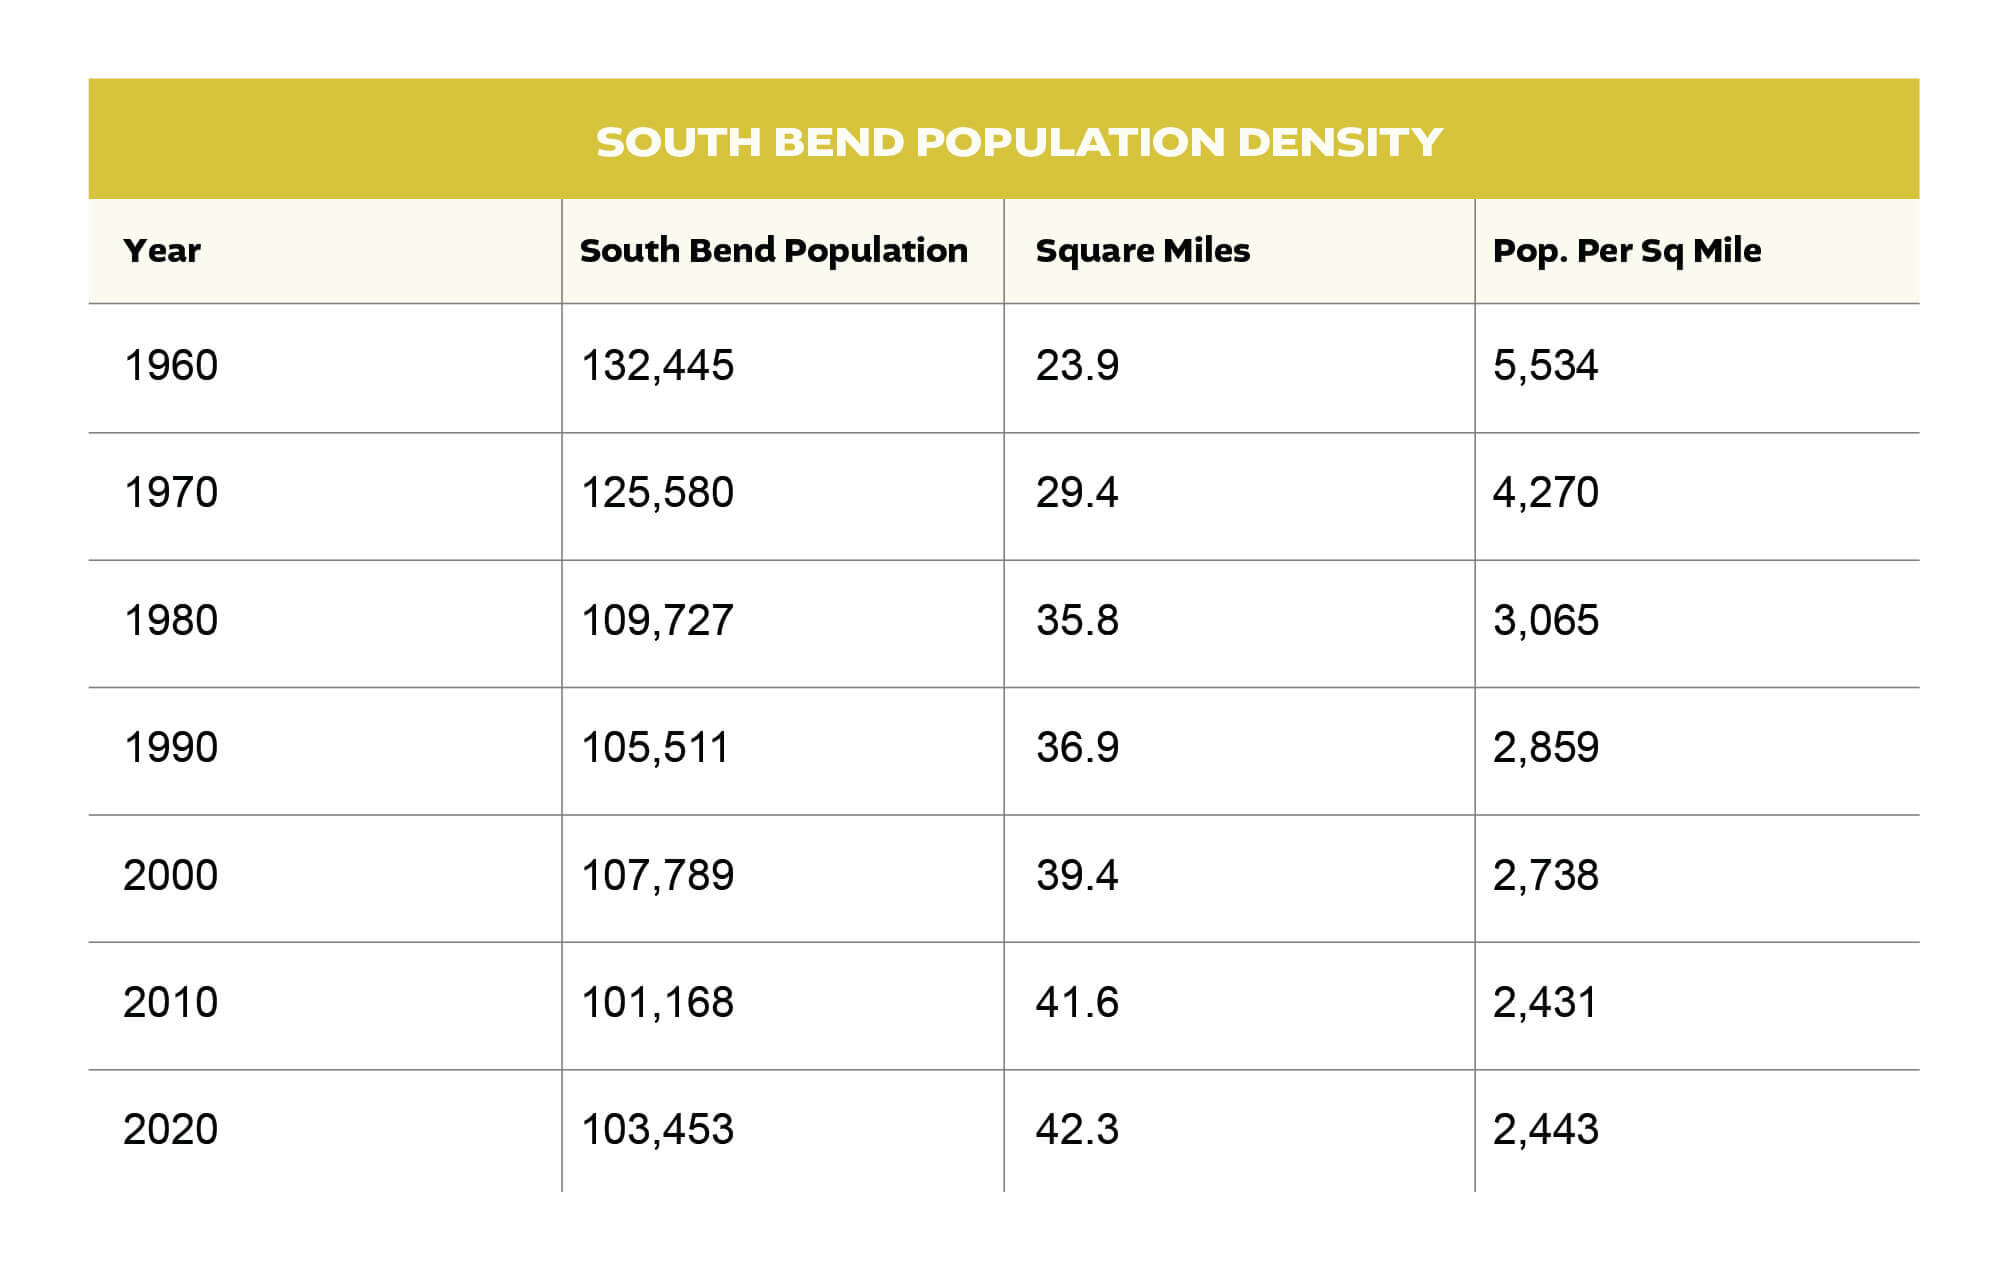
Again, the increase is not earth-shattering, but it is an increase. For the first time since 1960 - there's that phrase again - South Bend became denser. The loss of density is one of the primary negative effects of population decline. A less dense city leads to the same amount of roads to pave, areas to provide police and fire protection, and water/sewer pipes to maintain, but fewer people and resources to do so. For the first time in a long time, the City has more resources to cover these costs and not less.
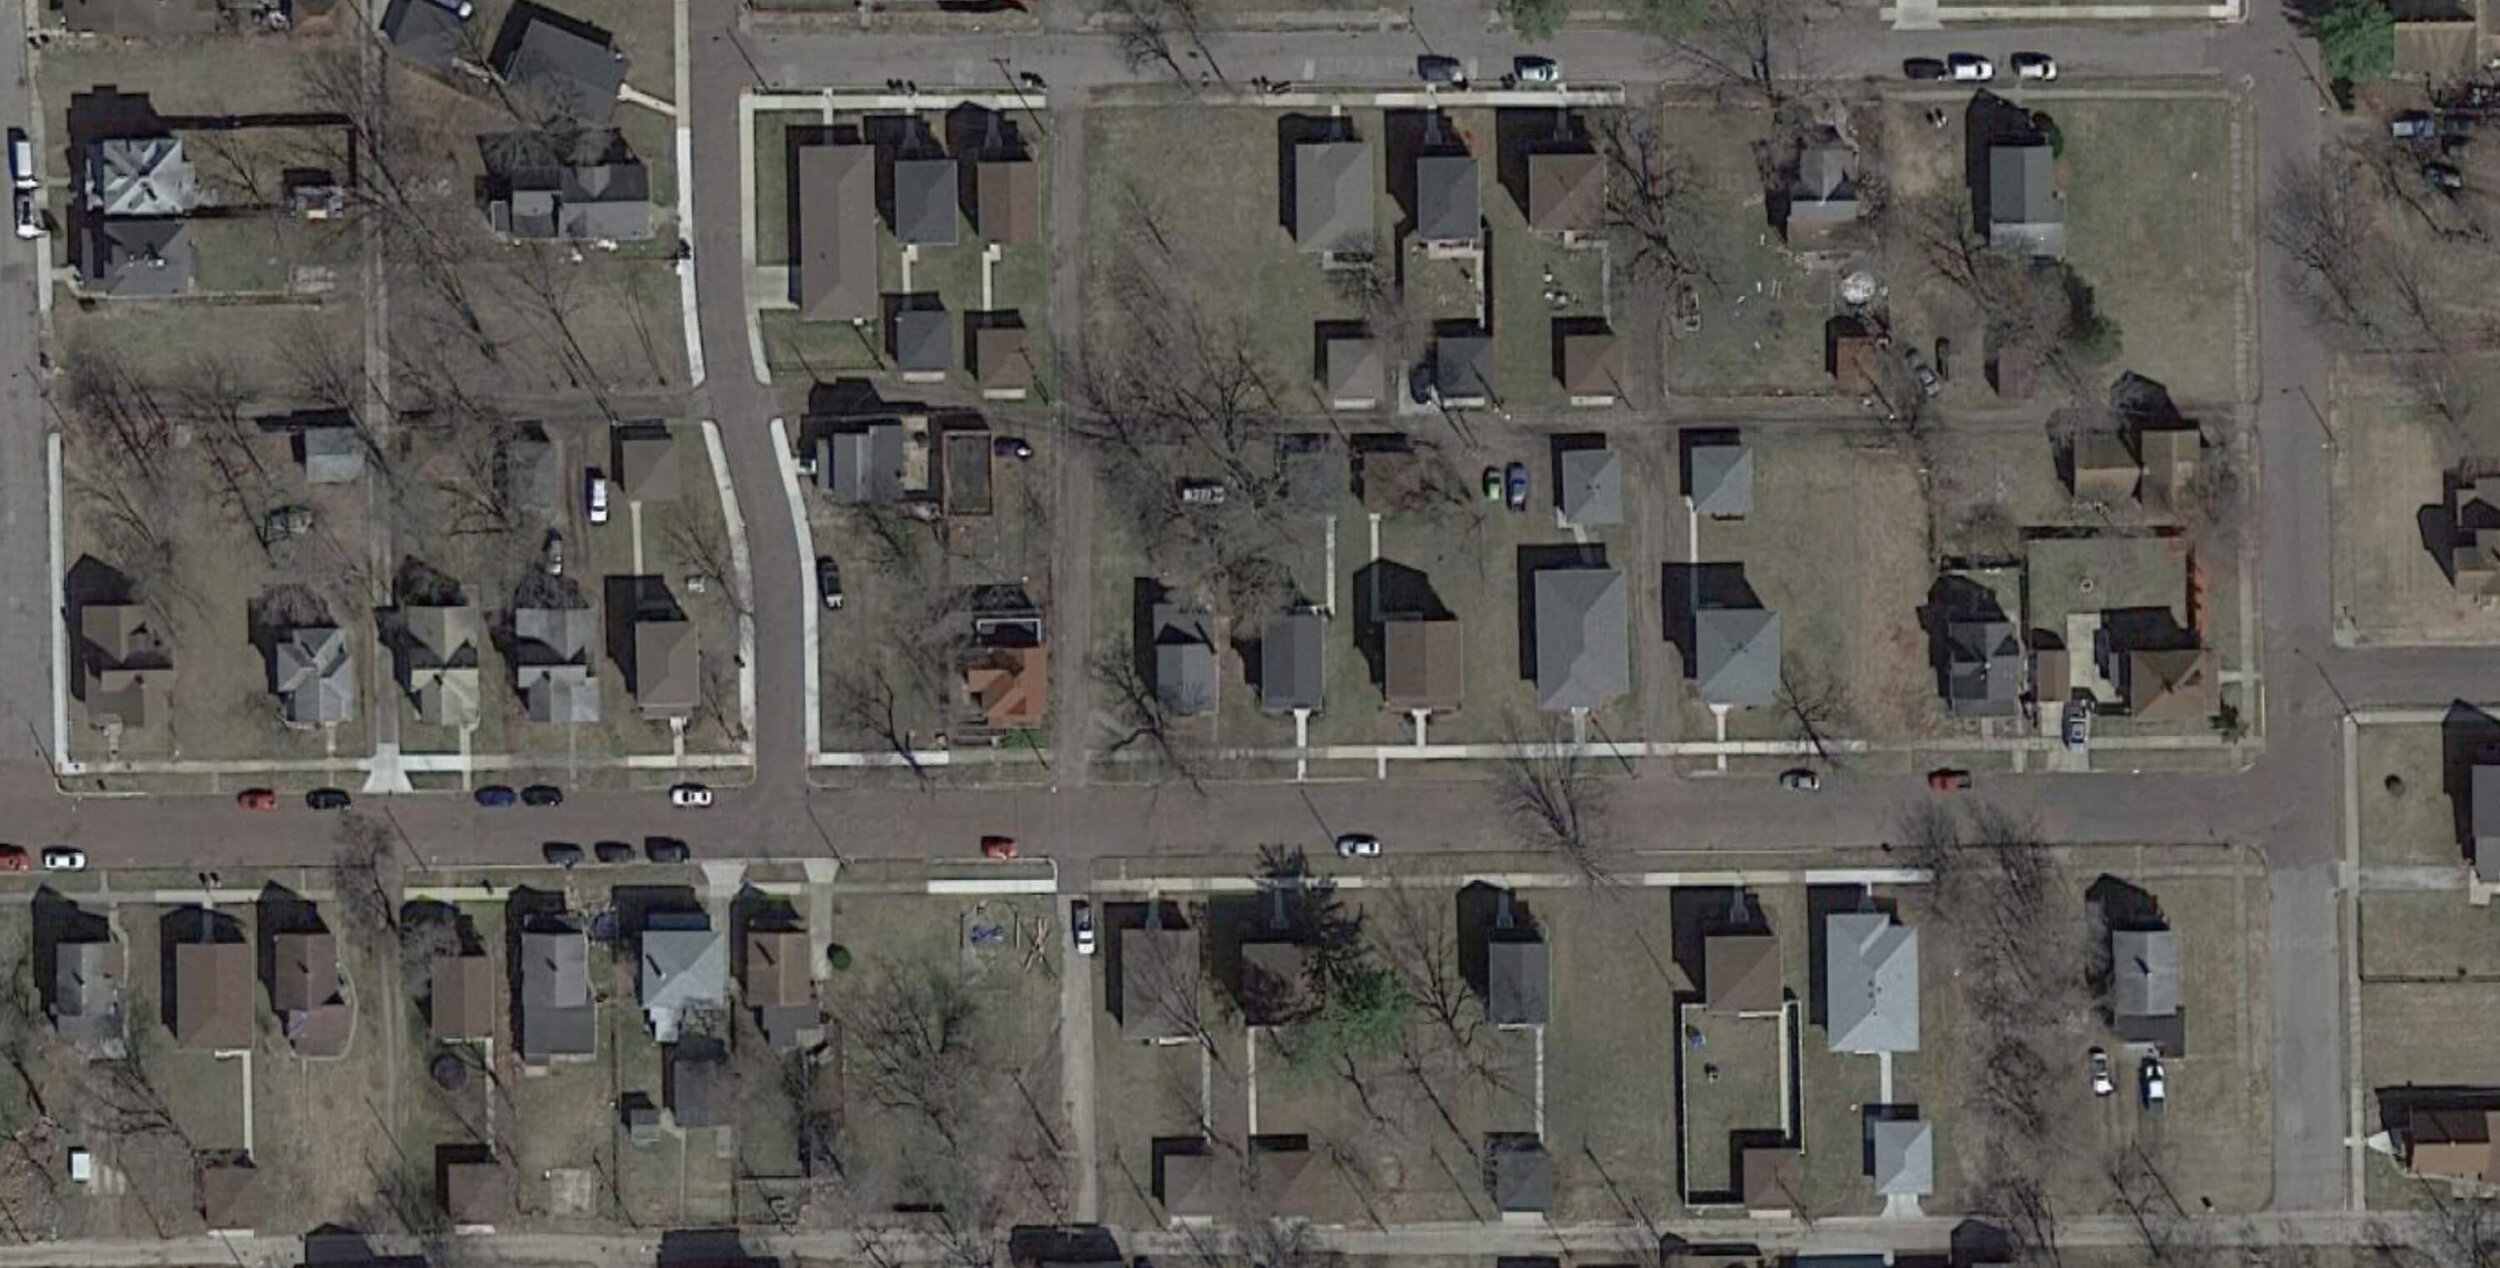
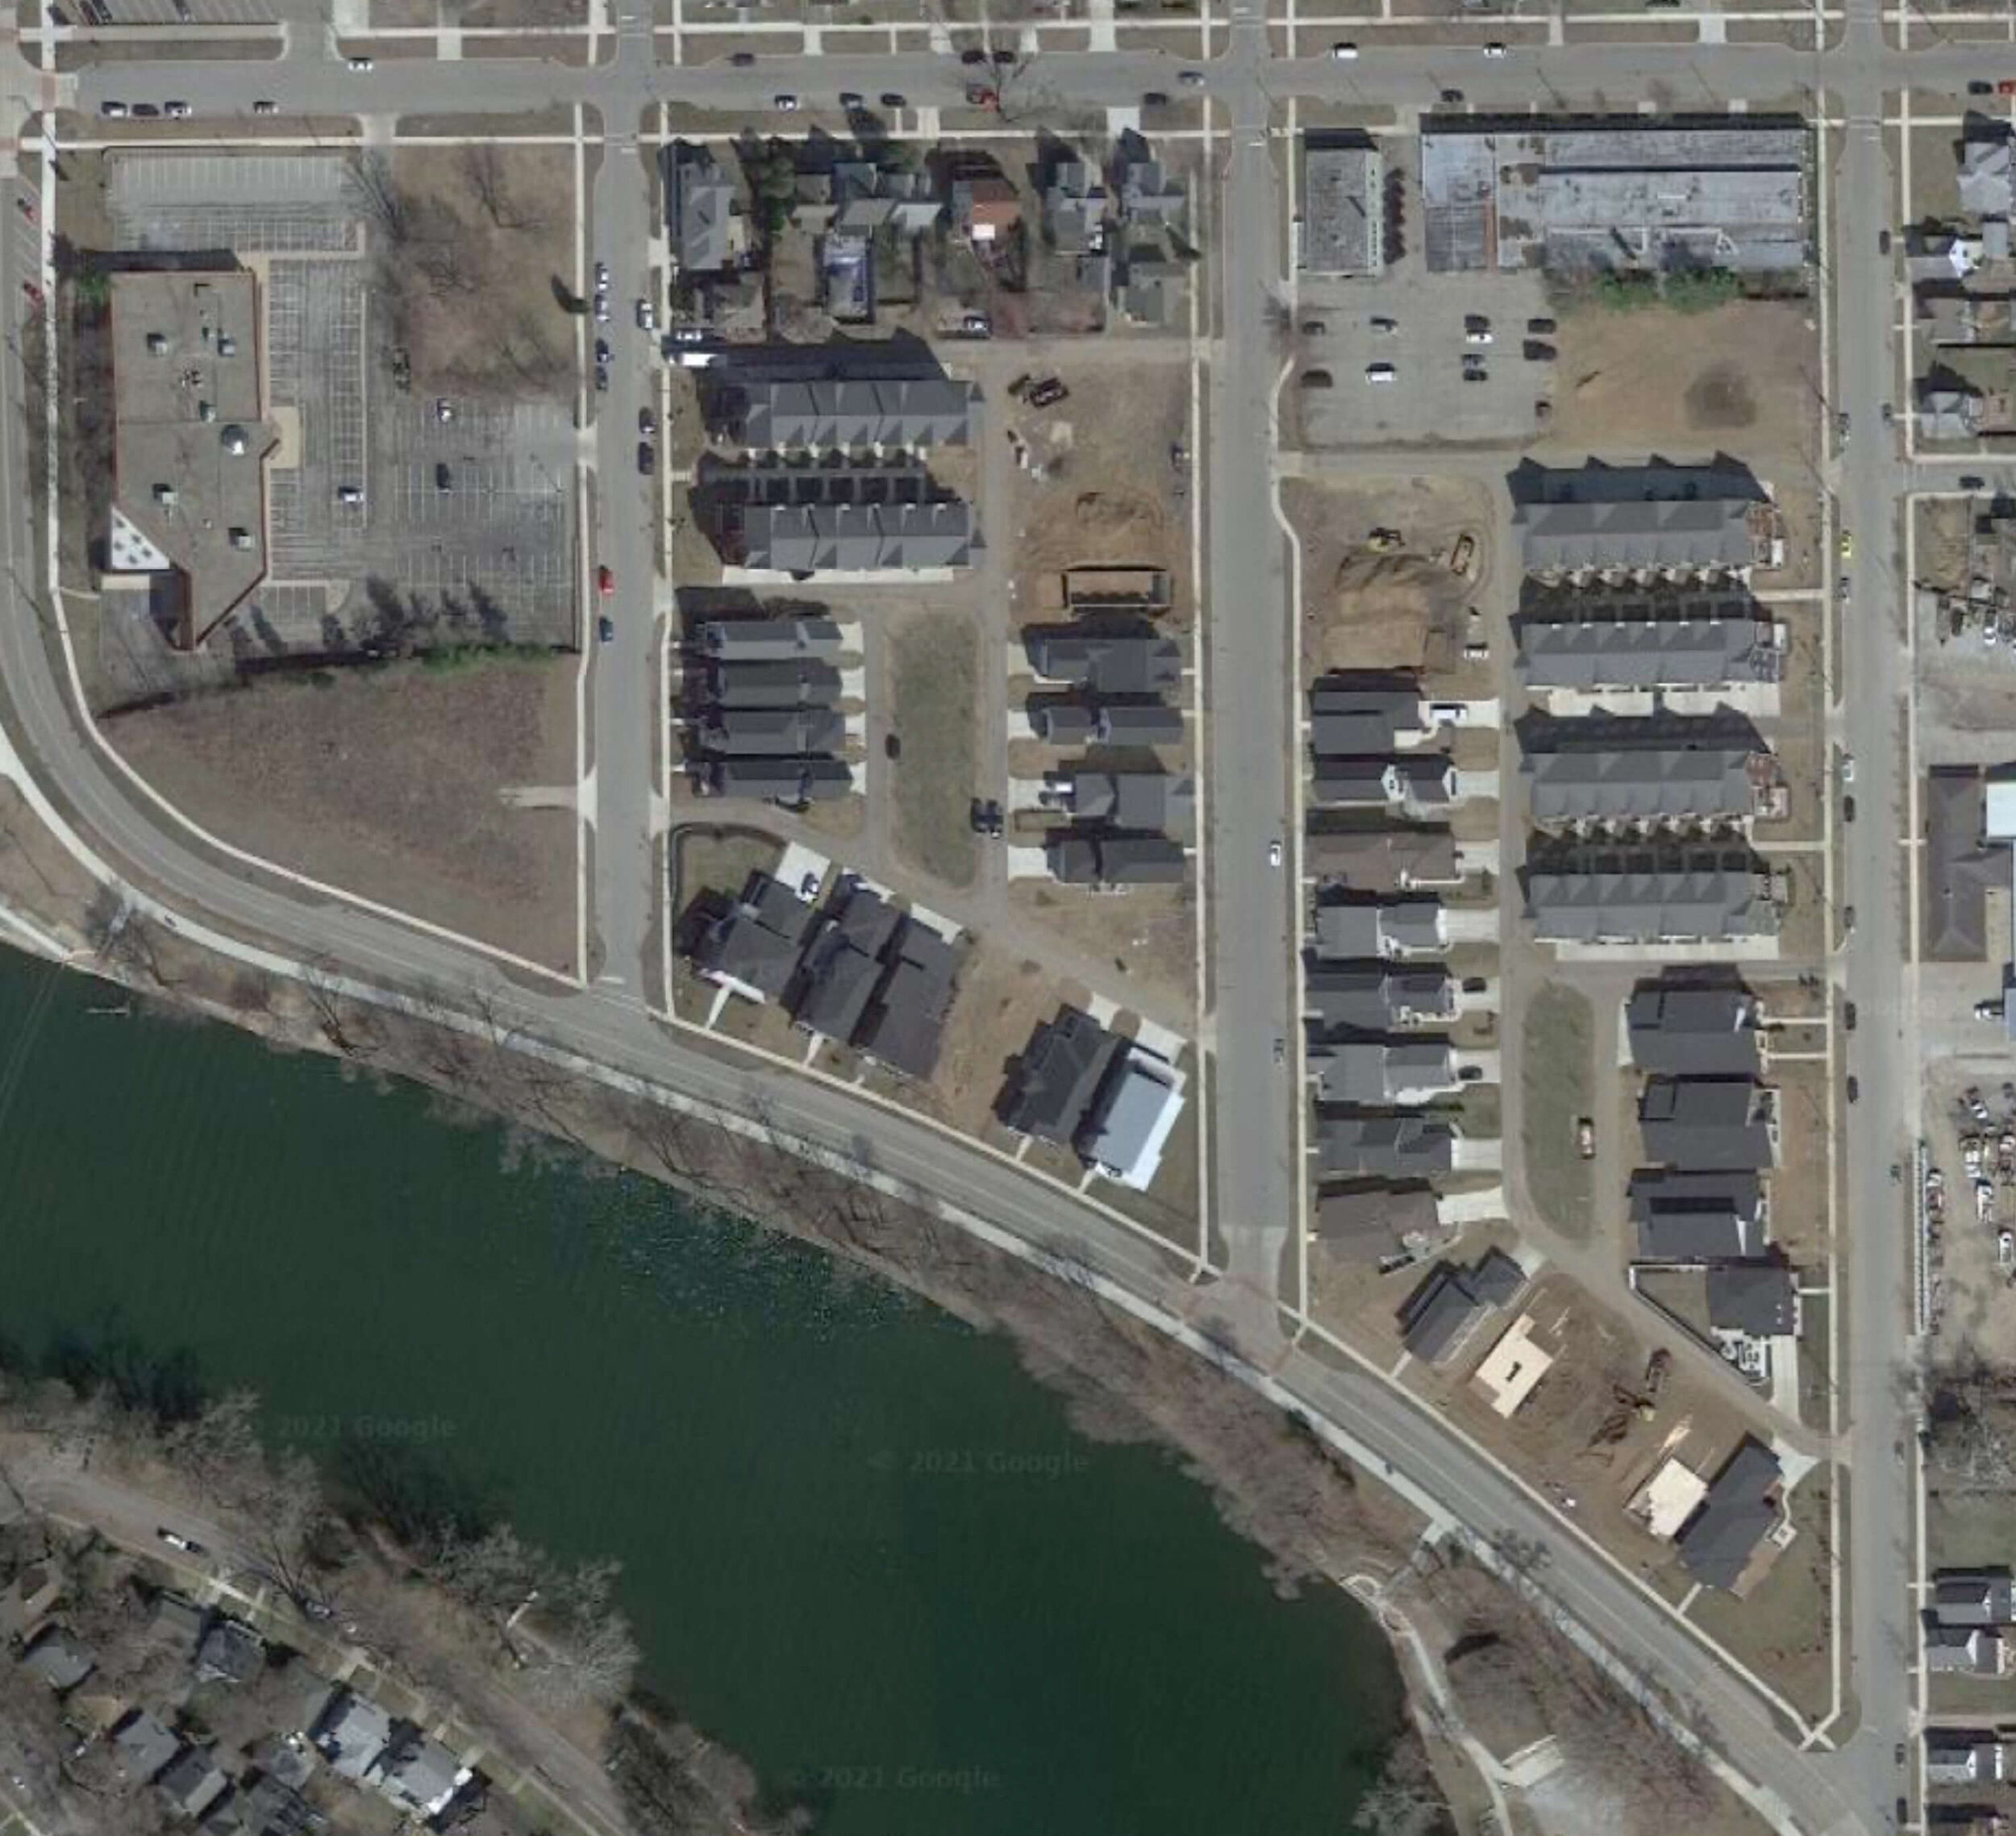
Residential Growth in the Lincoln Park Neighborhood. The fastest growing neighborhood in South Bend during the 2010s.
The most encouraging aspect of the 2020 Census from the South Bend perspective is not what position the City remains in today—because nearly all of the longstanding harms of population decline exist in nearly the same respect as they did in 2010. Instead, the most encouraging aspect is that you have to start somewhere, and the Census numbers suggest the beginning of something new.
As we will explore further, this growth also looks sustainable and replicable. It took fifty years for the city to fall. It will take at least as many to drag ourselves out of the hole the city finds itself in. In a few decades, we may look back on the 2010s as the decade when South Bend began its true recovery.
. . .
Next time, we will get into specifics about which neighborhoods fueled this growth and some troubling new issues that the 2020 Census revealed. Special thanks to Michael Divita, who has compiled nearly all of the data found in this piece.
Read recent posts