
More People: Suburbanization, not Studebaker

This is the introduction to an article and podcast series by Joe Molnar titled More People: How South Bend Lost 50,000 People in 50 Years. Joe is a proud 4th generation son of South Bend.
Read the original series: Introduction | One | Two | Three | Four | Five | Six | Seven
Read the census recap: Introduction | One | Two
Subscribe to the podcast: Apple | Spotify | Google | Stitcher | TuneIn

The corner of Adams and 23 in Granger, circa 1950.
“The fact that South Bend has shown an increase in spite of a trend toward suburban living indicates a healthy and sound condition and is a tribute to the many fine facilities the city offers in the way of schools, recreation, and police and fire protection. It is a sign of civic pride. It indicates South Bend’s prospects are brighter than ever before.”
– Mayor Edward F. Voorde, South Bend Tribune, May 18, 1960
• • •
Born in 1992, I was my parent’s third and final child. For the first few years of my life, I called the city limits of South Bend home. As my sisters and I grew, my parents felt the pressure of a five-person household in a three-bedroom house and decided to look for a larger home for their growing family. That new home ended up being on the far south side of town just outside the city limits in a brand-new subdivision.
This new home – while certainly enjoyed by my family – represented the direct threat South Bend was facing. When we moved, the city lost one household, two full-time income earners, and five total people. We were just one of the thousands of families that had followed this course of moving out to the suburbs. South Bend had a problem and knew it.
During that same year, 1992, the City released a report on annexation and its role, or lack thereof, in the growth of the city’s population in the second half of the 20th Century. It was evident to everyone that South Bend was undergoing severe transformations. The factories – Studebaker, crown jewel among them –had grown up with the city and now were closing their doors or moving away. Downtown, which once was the commercial, retail, office, and cultural hub of the entire region, had been hollowed out and deserted by most of its largest tenants. South Bend - in every sense of the word - was shrinking and yet was surrounded by an ever-growing region.
St. Joseph County, of which South Bend is the County Seat and largest city, has more people residing in its boundaries today than at any other time in history. More people live in St. Joe County now, then at the height of Studebaker, Bendix, and all the other manufacturing giants who called this county home. The county managed this increase in the same economy, job market, and weather conditions as South Bend. South Bend might have followed the same trajectory, but forces larger than the loss of factory jobs caused South Bend’s fall in population during the second half of the 20th Century.
I raise this point to say: the argument that South Bend would inevitably lose population due to the loss of Studebaker and other manufacturers does not hold water. If losing well-paying, blue-collar jobs dooms a community to population decline, why did Mishawaka and the unincorporated areas of the county, such as Granger, grow over the past half-century? Mishawaka has lost nearly 40% of its manufacturing jobs since 1960, but its population has not suffered a similar decline.¹
As was shown in the previous article, the decline in household size alone accounts for a significant portion of population loss in South Bend. Below is a chart tracking the number of households, population size, and household size of South Bend since 1940. This data comes from the United States Census²:
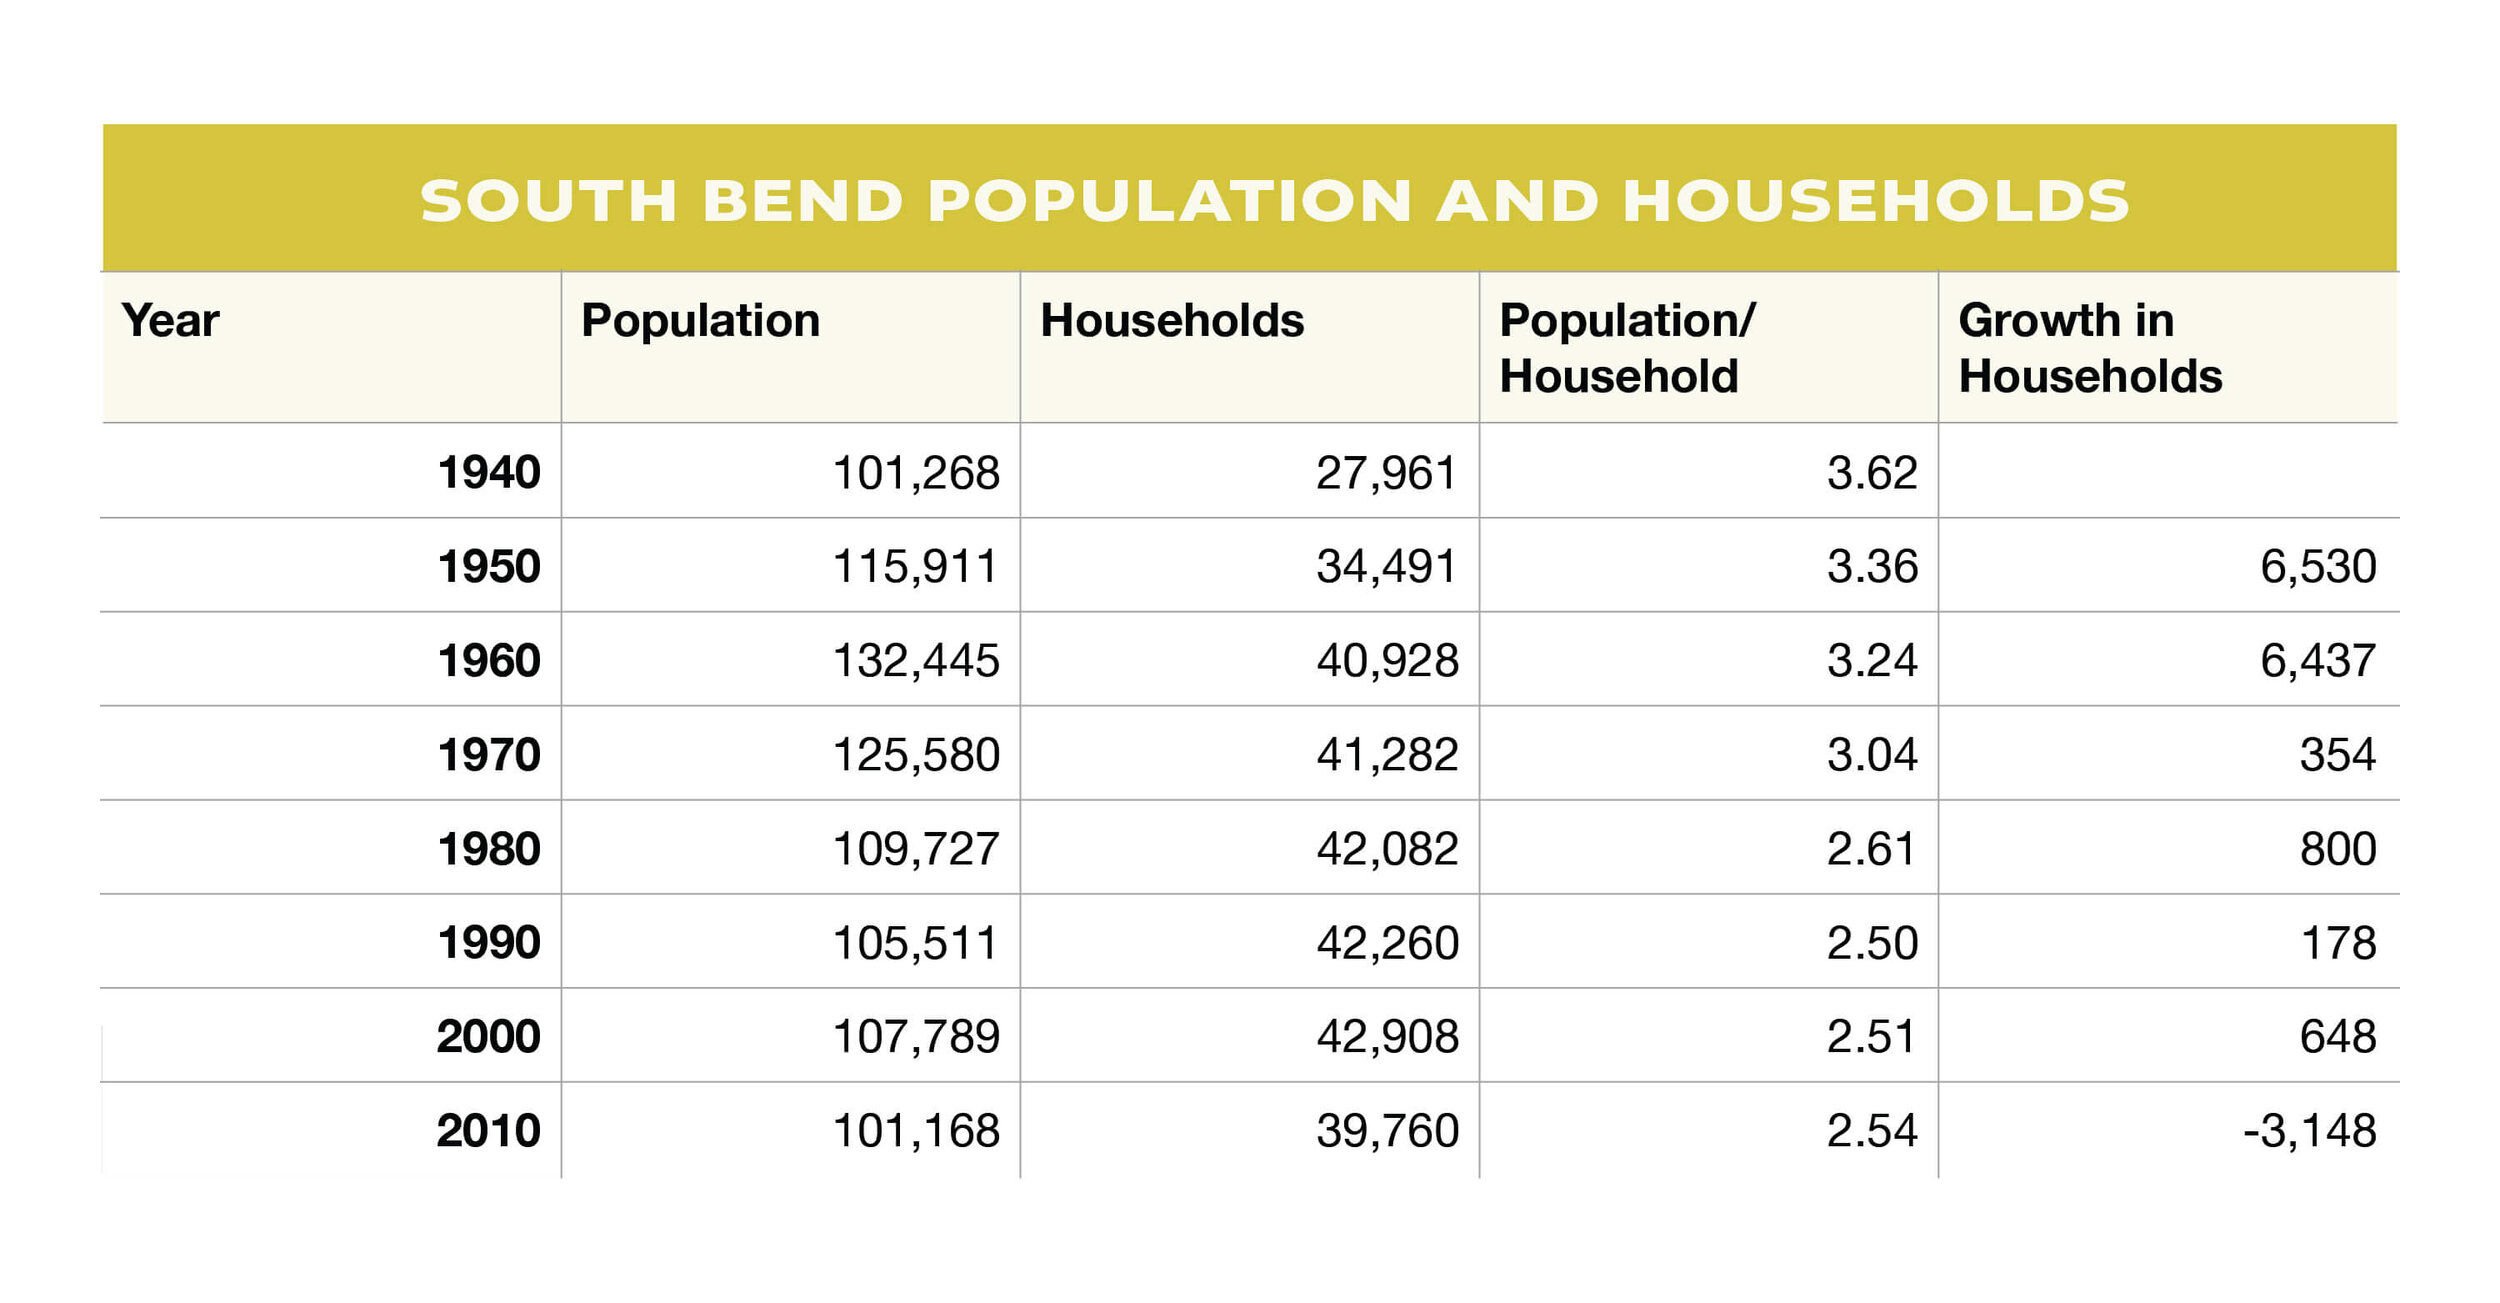
Looking at this chart, South Bend’s population history can be divided into four stages:
Rapid household growth: 1940 – 1960
Minimal household growth: 1960 – 1990
Stabilization: 1990 – 2000
Collapse: 2000 – 2010
Stage 1: Rapid household growth, 1940 – 1960
From 1940 through 1960, South Bend established approximately 650 new households every year, making up for the fact that in each decade, a typical household was smaller than in the decade prior.
Declining household size was a battle that South Bend had been fighting – and winning – for its entire existence, dating back to the mid-19th century. The average household size in the United States in 1850 was 5.55, and while we don’t have the exact statistics for South Bend, we can consider the national average a close comparison.³ By 1960, South Bend’s household size had fallen to 3.24. To grow, South Bend needed to add households at a stunningly fast rate. And it did.
These new households were built on the then fringe of South Bend’s city limits. Neighborhoods like Edison Park or Miami Hills, both mainly built in the early 1950s, consisted of homes less than 1,000 square feet on 8,000 square foot city lots. This was the first large wave of suburbanization to come to St. Joseph County in the immediate years following World War II. As Americans began to desire larger lots in more suburban-style neighborhoods, South Bend accommodated these desires by building subdivisions within the city limits and linking them to the larger South Bend grid network.

Typical 1950s advertisement to move out to the suburbs
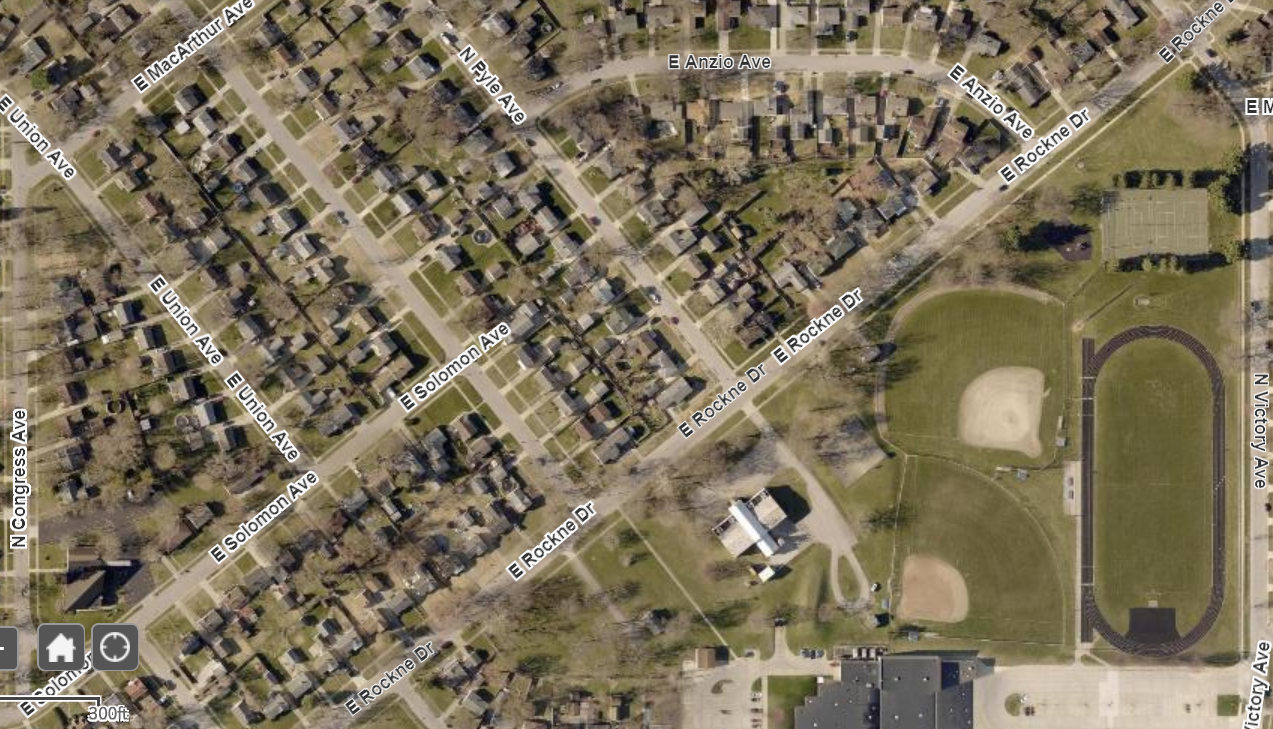
Edison Park Neighborhood Aerial, sourced from southbendin.gov/zoning
These new neighborhoods helped South Bend’s population growth, despite the loss in population per household, as the new housing also counteracted the vacant or abandoned housing that began to be detected in South Bend’s oldest neighborhoods. As Mayor Voorde’s quote at the beginning of this article demonstrates, South Bend was growing despite people leaving cities for suburbs, and it managed to do so by ensuring that a large portion of St. Joseph County’s suburban growth happened within the boundaries of South Bend. While these new neighborhoods were less dense and notably less urban than South Bend’s older neighborhoods, they still mostly formed to the city grid pattern and integrated into the broader urban fabric.
As pointed out in the previous article, these new neighborhoods were almost exclusively white. Many of their homes were built with Federal Government-backed Federal Housing Authority (FHA) loans, who had a policy against issuing loans for the construction of integrated housing, compounding onto the fact that African Americans were not eligible for Veteran Affairs mortgage loans that were offered to the white soldiers also returning from World War II. Denial of new housing opportunities to African Americans began to deepen the greater segregation of the South Bend community, concentrating Black populations in older neighborhoods, which were denied resources for improvement.
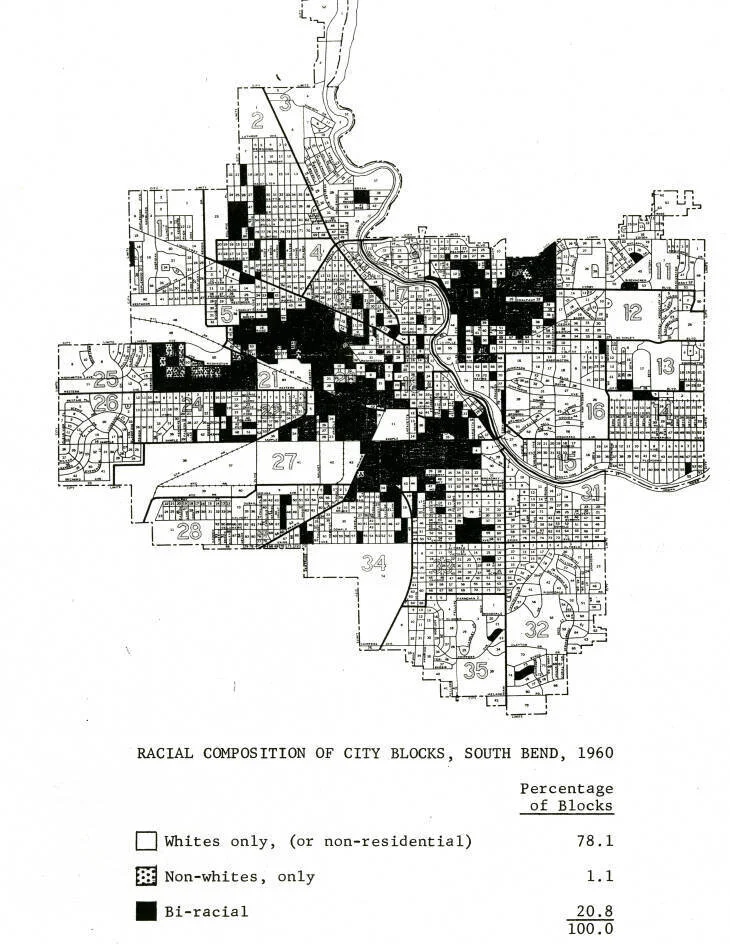
1960 Racial Composition Map, U.S. Census 1960
In 1960, South Bend reached a new height in population at 132,445 and a new height in households with 40,928. At this point, the city was establishing households at a pace fast enough to increase the total population. That growth – while not ending – took a nosedive starting in the 1960s.
Stage 2: Minimal household growth, 1960 – 1990
Something changed in the 1960s. During the decade, South Bend gained just 354 households. The very same city that had added over 650 households every year barely managed to add half that amount in an entire decade. This paltry growth was combined with a continued decline in household size, resulting in the largest population decline in the city’s history until that point. This decrease was the beginning of a painful trend that would last for thirty more years.
While South Bend did not stop growing in the second half of the 20th century, it stopped growing fast enough to add to its population. South Bend's peak number of households was in the 2000 Census—something that I certainly did not know until really digging into this topic.
When taking a casual look at South Bend’s overall population decline, the 1970s stand out as the worst decade both in percentage drop and the number of people. When looking at the household data, however, the 1970s added 800 households, which is the most of any decade following the 1950s.
From 1960 through 1990, South Bend lost nearly 25,000 residents but added 1,250 households. South Bend – despite the trends of suburbanization and deindustrialization – was still attractive enough to new residents to grow its number of households, primarily by annexing suburban areas at the city limits. If the size of each household had remained constant, the city would have gained over 6,000 residents during those forty years.
When trying to discuss and analyze South Bend’s population decline from 1960 through 1990, two questions become apparent: Why did South Bend lose approximately 25,000 people in three decades? And why did South Bend not grow enough to compensate for its decline in household size?
The answer to the first question is simple. South Bend’s population decline during the latter part of the 20th century occurred due to declining household size. That’s it. This part of the puzzle is not that complicated. South Bend began to lose its lifelong battle against ever-shrinking household size, and, over time, thousands of fewer people resided in South Bend.
The second question is more complicated. For South Bend’s entire history, the city was able to make up for the declining population per household. So what changed in the 1960s? Why did Mishawaka and the unincorporated areas of St. Joseph County continue to grow despite suffering the same similar demographics, but South Bend did not?
All of St. Joseph County faced clear economic consequences from deindustrialization. While population growth for the entire county slowed dramatically, starting in the 1960s, the county as a whole still experienced an increase in the following decades. Of the county’s three primary entities: South Bend, Mishawaka, and unincorporated St. Joseph County – only South Bend suffered severe population decline. If economics alone were responsible for South Bend’s fate, it would have been shared more broadly across the three jurisdictions.
As detailed above, for the first fifteen years after the end of World War II, many of the new suburban subdivisions were built inside of South Bend’s city limits. South Bend captured approximately 41% of new households in St. Joseph County from 1940 to 1960. However, from 1960 through 2000, South Bend captured just 6% of household growth in the county. This inability to capture suburban growth, more so than deindustrialization, led to South Bend losing thousands of residents.
In 1960, South Bend consisted of more than half of all the households in St. Joseph County, but captured just 6% of household growth in the following four decades. This is a titanic shift in the population of one county over a relatively short amount of time. The number of households in unincorporated land, outside of South Bend and Mishawaka, more than doubled, from 18,394 to 37,587. While South Bend was not losing households, almost 95% of all new household creation was outside its borders.
Despite the demise of St. Joseph County’s primary manufacturing industries, the local job market was able to support a continued increase in both population and households throughout these decades. The difference during this period was South Bend’s inability to capture a large percentage of this suburban growth as it had previously.

South Bend was not doomed to lose population when Studebaker closed its doors in December of 1964, just as Mishawaka was not doomed to lose population when Uniroyal closed its doors. Every indication suggests that even if Studebaker survived, South Bend was not gaining enough new households to make up for its decline due to shrinking household size and suburbanization.
Unlike other Hoosier cities such as Indianapolis or Fort Wayne, South Bend did not successfully implement large scale annexation plans to absorb its growing suburbs. Indianapolis consolidated with Marion County to create Unigov in 1970, helping hide its declining inner-city neighborhoods. Likewise, Fort Wayne’s boundaries grew massively during the later part of the 20th century from 38 square miles in 1960 to 110 square miles today. Fort Wayne’s current website states, “Since the early 1950's Fort Wayne has extensively utilized annexation as a tool to keep up with the patterns of suburban sprawl. In fact, over 175 individual annexations have been initiated by Fort Wayne over the past five decades. These annexations included both voluntary and involuntary annexations.”⁵ Fort Wayne today – while not fused with its county like Indianapolis – is over 110 square miles large compared to South Bend’s 42 square miles. Comparatively, South Bend did not capture the growth in its suburbs at the same rate as other Hoosier cities.
City leaders at the time understood that most population growth was occurring outside of the city limits and in unincorporated suburbs. The City’s 1992 report detailing South Bend’s annexation history in the late 20th century (which can be accessed by a link in the sources) acknowledges “the City’s recognition and attempt, in the late 1960s to early 1970s, to catch up with the areas shifting demographics and remain as the region’s primary growth center.” For reasons that will be explored in a further article, South Bend was not able to succeed in its attempts at wide-scale suburban annexations beyond limited piecemeal annexations to the south and north-west.
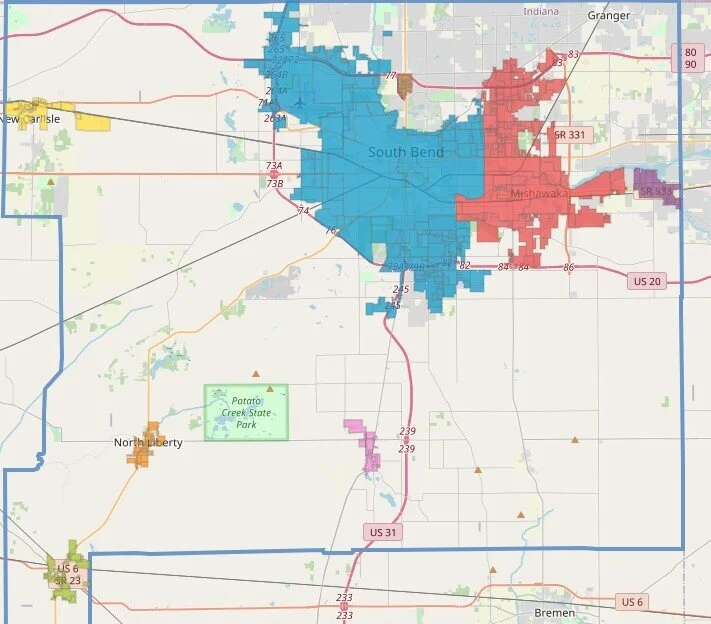
Current boundaries of the incorporated cities and towns of St. Joseph County. Note the high level of development north of South Bend and Mishawaka that is unincorporated.
From 1960 to 2010, Fort Wayne nearly tripled its physical boundaries. During the same period, Mishawaka more than doubled from 7.3 square miles to 17.3 square miles. South Bend, however, only grew from 24 square miles to 41.6 square miles, a much smaller percentage of increase than either Fort Wayne or Mishawaka. It should be noted that much of the suburban development pattern of this time consisted of large single-family homes or large big-box stores in suburban style strip malls. This type of development often, over time, does not generate enough property taxes to pay for the infrastructure which it requires. The benefits and downsides of annexation will be explored in a future article.
Americans in the second half of the 20th century were looking for larger and larger homes every decade. By 1960, over half of the housing units in South Bend were over thirty years old, built before the Great Depression. These units were usually smaller and lacked the amenities that newer homes typically contained.⁶ Americans wanted bigger homes than South Bend could provide. The average home in the United States in 1950 was just about 1,000 square feet. This number jumped to 1,725 square feet in 1983, and 2,330 square feet in 2003.⁷
These new houses were often backed by FHA loans, which, even deep into the late 20th century, had official and unofficial policies discouraging housing developments destined to be integrated from being insured. As South Bend and other cities across the country integrated their school systems in the 1970s, the easiest way to ensure your child would not go to an integrated school was to move to the suburbs and leave the school district. South Bend was home to 95% of the African American population of St. Joseph County in 1970.⁸
If you wanted to live in a neighborhood that would guarantee your child would go to a “good” (read white) school, then you left the South Bend School District.
It’s important to note that, between 1960 and 2000, the population of only white residents declined in South Bend. As the chart below demonstrates, all other populations rose during this time frame, just at slower rates than white decline.

There were other factors as well leading to growth specifically outside of South Bend city limits. The 1992 Annexation Report referenced above gives the following as reasons for suburban growth which I have summarized: 1. Increased mobility resulted in the ability to seek jobs and live in areas not served by public transportation. 2. Liberal extension of sewer and water service beyond city limits, allowing opportunities for high-density projects such as apartments in the County. 3. Large numerous tracts of developable land can accommodate newer and larger homes. 4. The soil in our region is generally suitable for private well and septic systems - a difference between St. Joseph County and Allen County home of Fort Wayne - combined with loose state law governing such systems contributed to the encouragement of development without central sewer and water facilities. 5. The development requirements in the County are generally less rigorous than those of South Bend, such as no requirement for sidewalks, streetlights, sewer and water lines, or fire hydrants. 6. No county-wide growth management plan which would have recognized the cost of haphazard land development.⁹
The points listed in the report are very development orientated – and certainly played a large part in growth being concentrated outside city limits - here I would add a few more not touched upon by the report. 1. At the time, property tax rates inside the city limits were higher than those in the unincorporated county (this distinction has largely been removed through the State imposed property tax caps). 2. Real and perceived threats of crime often were and are still used as an excuse not to live in certain city neighborhoods. 3. Schooling, which was discussed above. 4. South Bend’s role as job center weakened and other employment centers like Elkhart County grew, the northeastern (Granger) portion of the county grew rapidly with some of this development spilling back into Mishawaka’s suburban northside. 5. Cultural norms that normalized the idea that bigger was always better in terms of housing and land.
Not one of these issues was the sole contributor to South Bend’s failure to capture suburban growth. Combined, however, they formed a significant barrier that South Bend could not overcome. When households – primarily white - left South Bend for suburban-style development in the other areas of St. Joseph County, these households were replaced but by families of smaller sizes, which led to the decline in South Bend’s overall population. Suburbanization, and not solely the closure of Studebaker and other manufacturing giants, played a primary role in South Bend’s population decline.
Stage 3: Stabilization, 1990 - 2000
South Bend’s lifelong battle against declining household size finally ended in the 1990s. For the first time in its recorded history, South Bend’s population per household grew slightly from 1990 to 2000. This reversal was accompanied by South Bend’s typical minimal household growth, which led to the first population growth since the 1950s. By most indications, South Bend weathered the two storms of suburbanization and deindustrialization and came out the other end. Since the number of households continued to go up and the population per household appeared to bottom out, it was conceivable that 1990 was going to be the population low for the city. Even vacant housing units – which doubled from 1960 through 1990 – fell from 3,497 to 3,441.
Real estate boomed during the 1990s and into the early 2000s. This helped fuel housing construction everywhere in the country and South Bend’s moderately priced market was pulled along as well. The 1990s were also the best decade for population and household growth in St. Joseph County as a whole since the 1950s and the county's rising tide likely lifted South Bend’s boat along with it.
Heading into the new millennium, South Bend’s population began to move in the right direction, cities across the country were starting to recover from their 1970s and 80s nadir, and the benefits of urban living were beginning to be acknowledged by broad sectors of the population.
As indicated by the chart above, increased immigration from South and Central America helped bring new residents to the city. These immigrants usually had large household sizes, and, as we saw in the last article, multiple neighborhoods began gaining population due to immigration, even if they were still decreasing in the number of households.
Unfortunately, this new optimum was fragile. In the next article, we’ll look at the 2000s and discuss how this newly discovered growth withered in the face of the Great Recession and the real estate bubble burst which preceded it. For the first time in South Bend’s history, the city would lose not just population but also actual households, while at the same time vacant units would double, leaving the city with no good options as some of its most fragile neighborhoods hollowed out.