More People: No Neighborhood in South Bend Avoided Decline

This is the introduction to an article and podcast series by Joe Molnar titled More People: How South Bend Lost 50,000 People in 50 Years. Joe is a proud 4th generation son of South Bend.
Read the original series: Introduction | One | Two | Three | Four | Five | Six | Seven
Read the census recap: Introduction | One | Two
Subscribe to the podcast: Apple | Spotify | Google | Stitcher | TuneIn
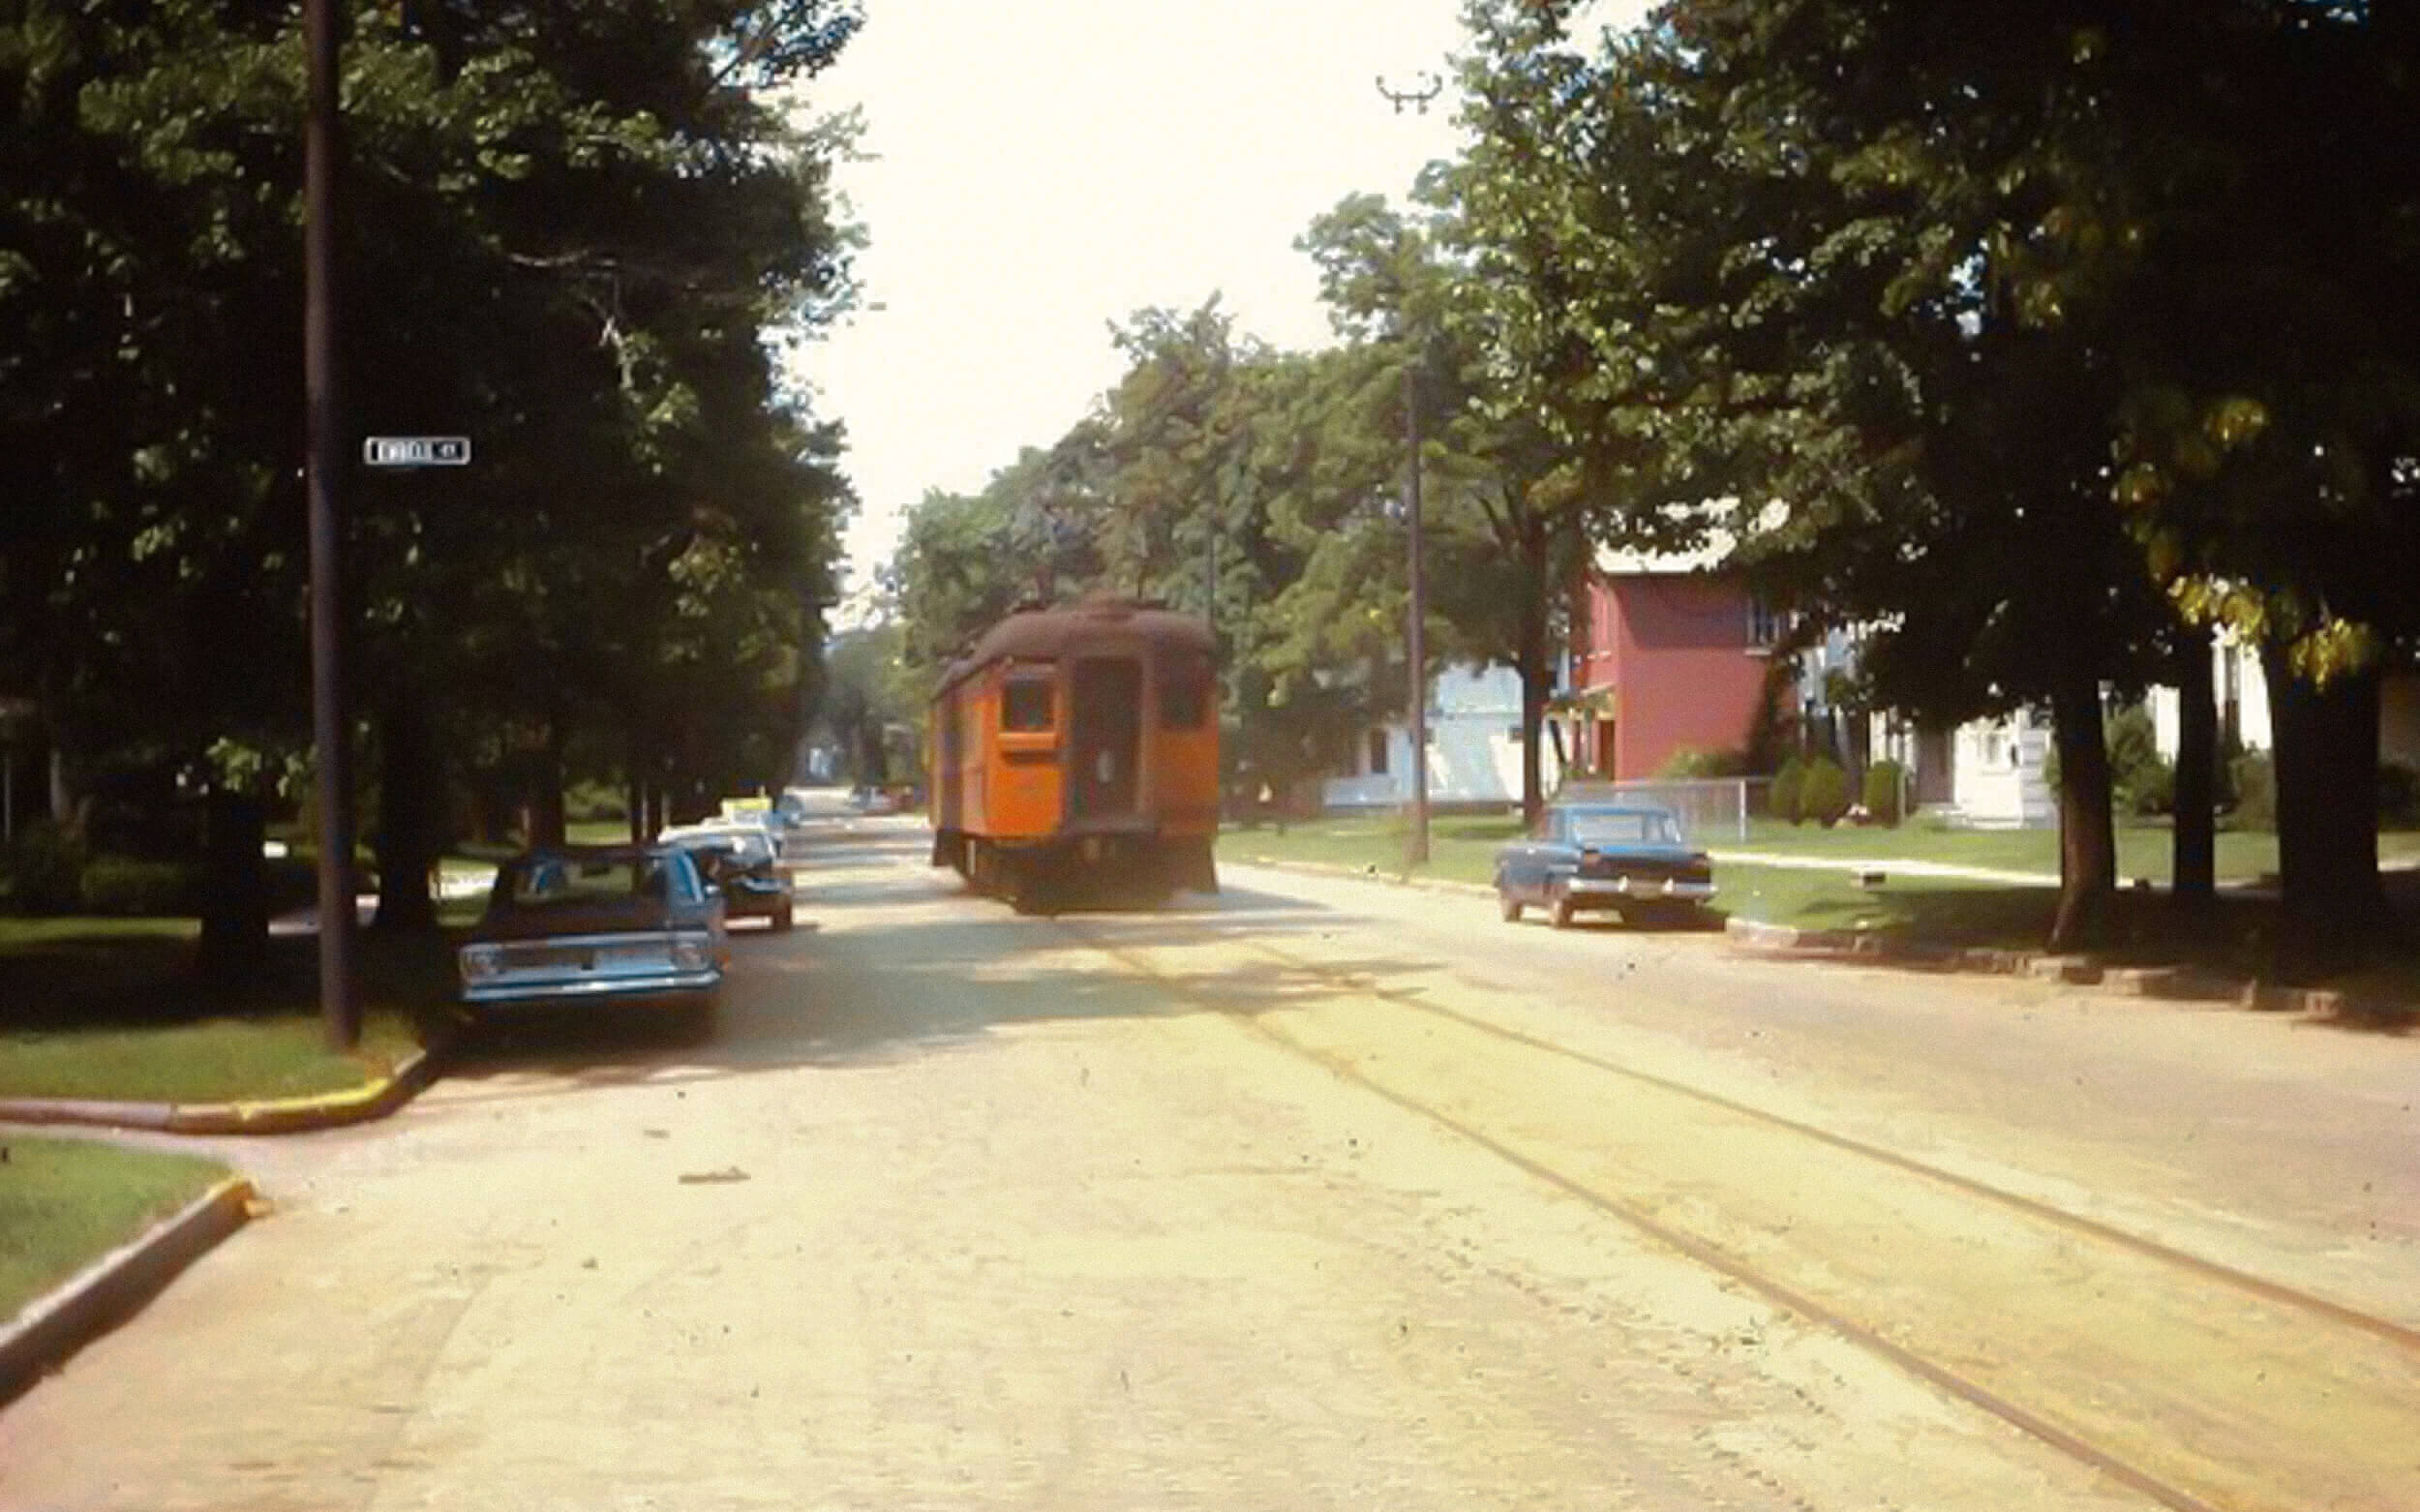
The corner of Lasalle and Embell Streets in South Bend, 1969.
I live in Sunnymede, a 1920s neighborhood with tightly packed and well maintained American Foursquares. There is not a vacant lot to be found, but Sunnymede has lost over six hundred people in the past few decades. My neighborhood and others like it are the first type of neighborhood decline that we will explore through this piece, and there are two others, all of which have contributed to South Bend losing nearly a quarter of its population.
Most people know South Bend has lost population since the middle of the 20th century. It’s visually evident in many neighborhoods and is part of our city’s common knowledge. However, for the purpose of grounding the beginning of this series in the facts, let’s do a recap.
In 1960, South Bend’s population peaked at 132,445, according to the decennial census. In the 2010 census (the most recent official count), the population stood at 101,168. That’s a loss of 31,277 people, or about one quarter of the city’s total population.
Let’s think about that for a moment. In 50 years, South Bend lost a quarter of its population while during that same time the country grew by over 40%. While this fact should not be normal, it is the status quo for dozens of other cities like South Bend across the country.
How did it happen? This first article will examine that this loss of population happened everywhere throughout the 1960 city boundaries. This was not just a West Side problem. It was and is an entire city problem.
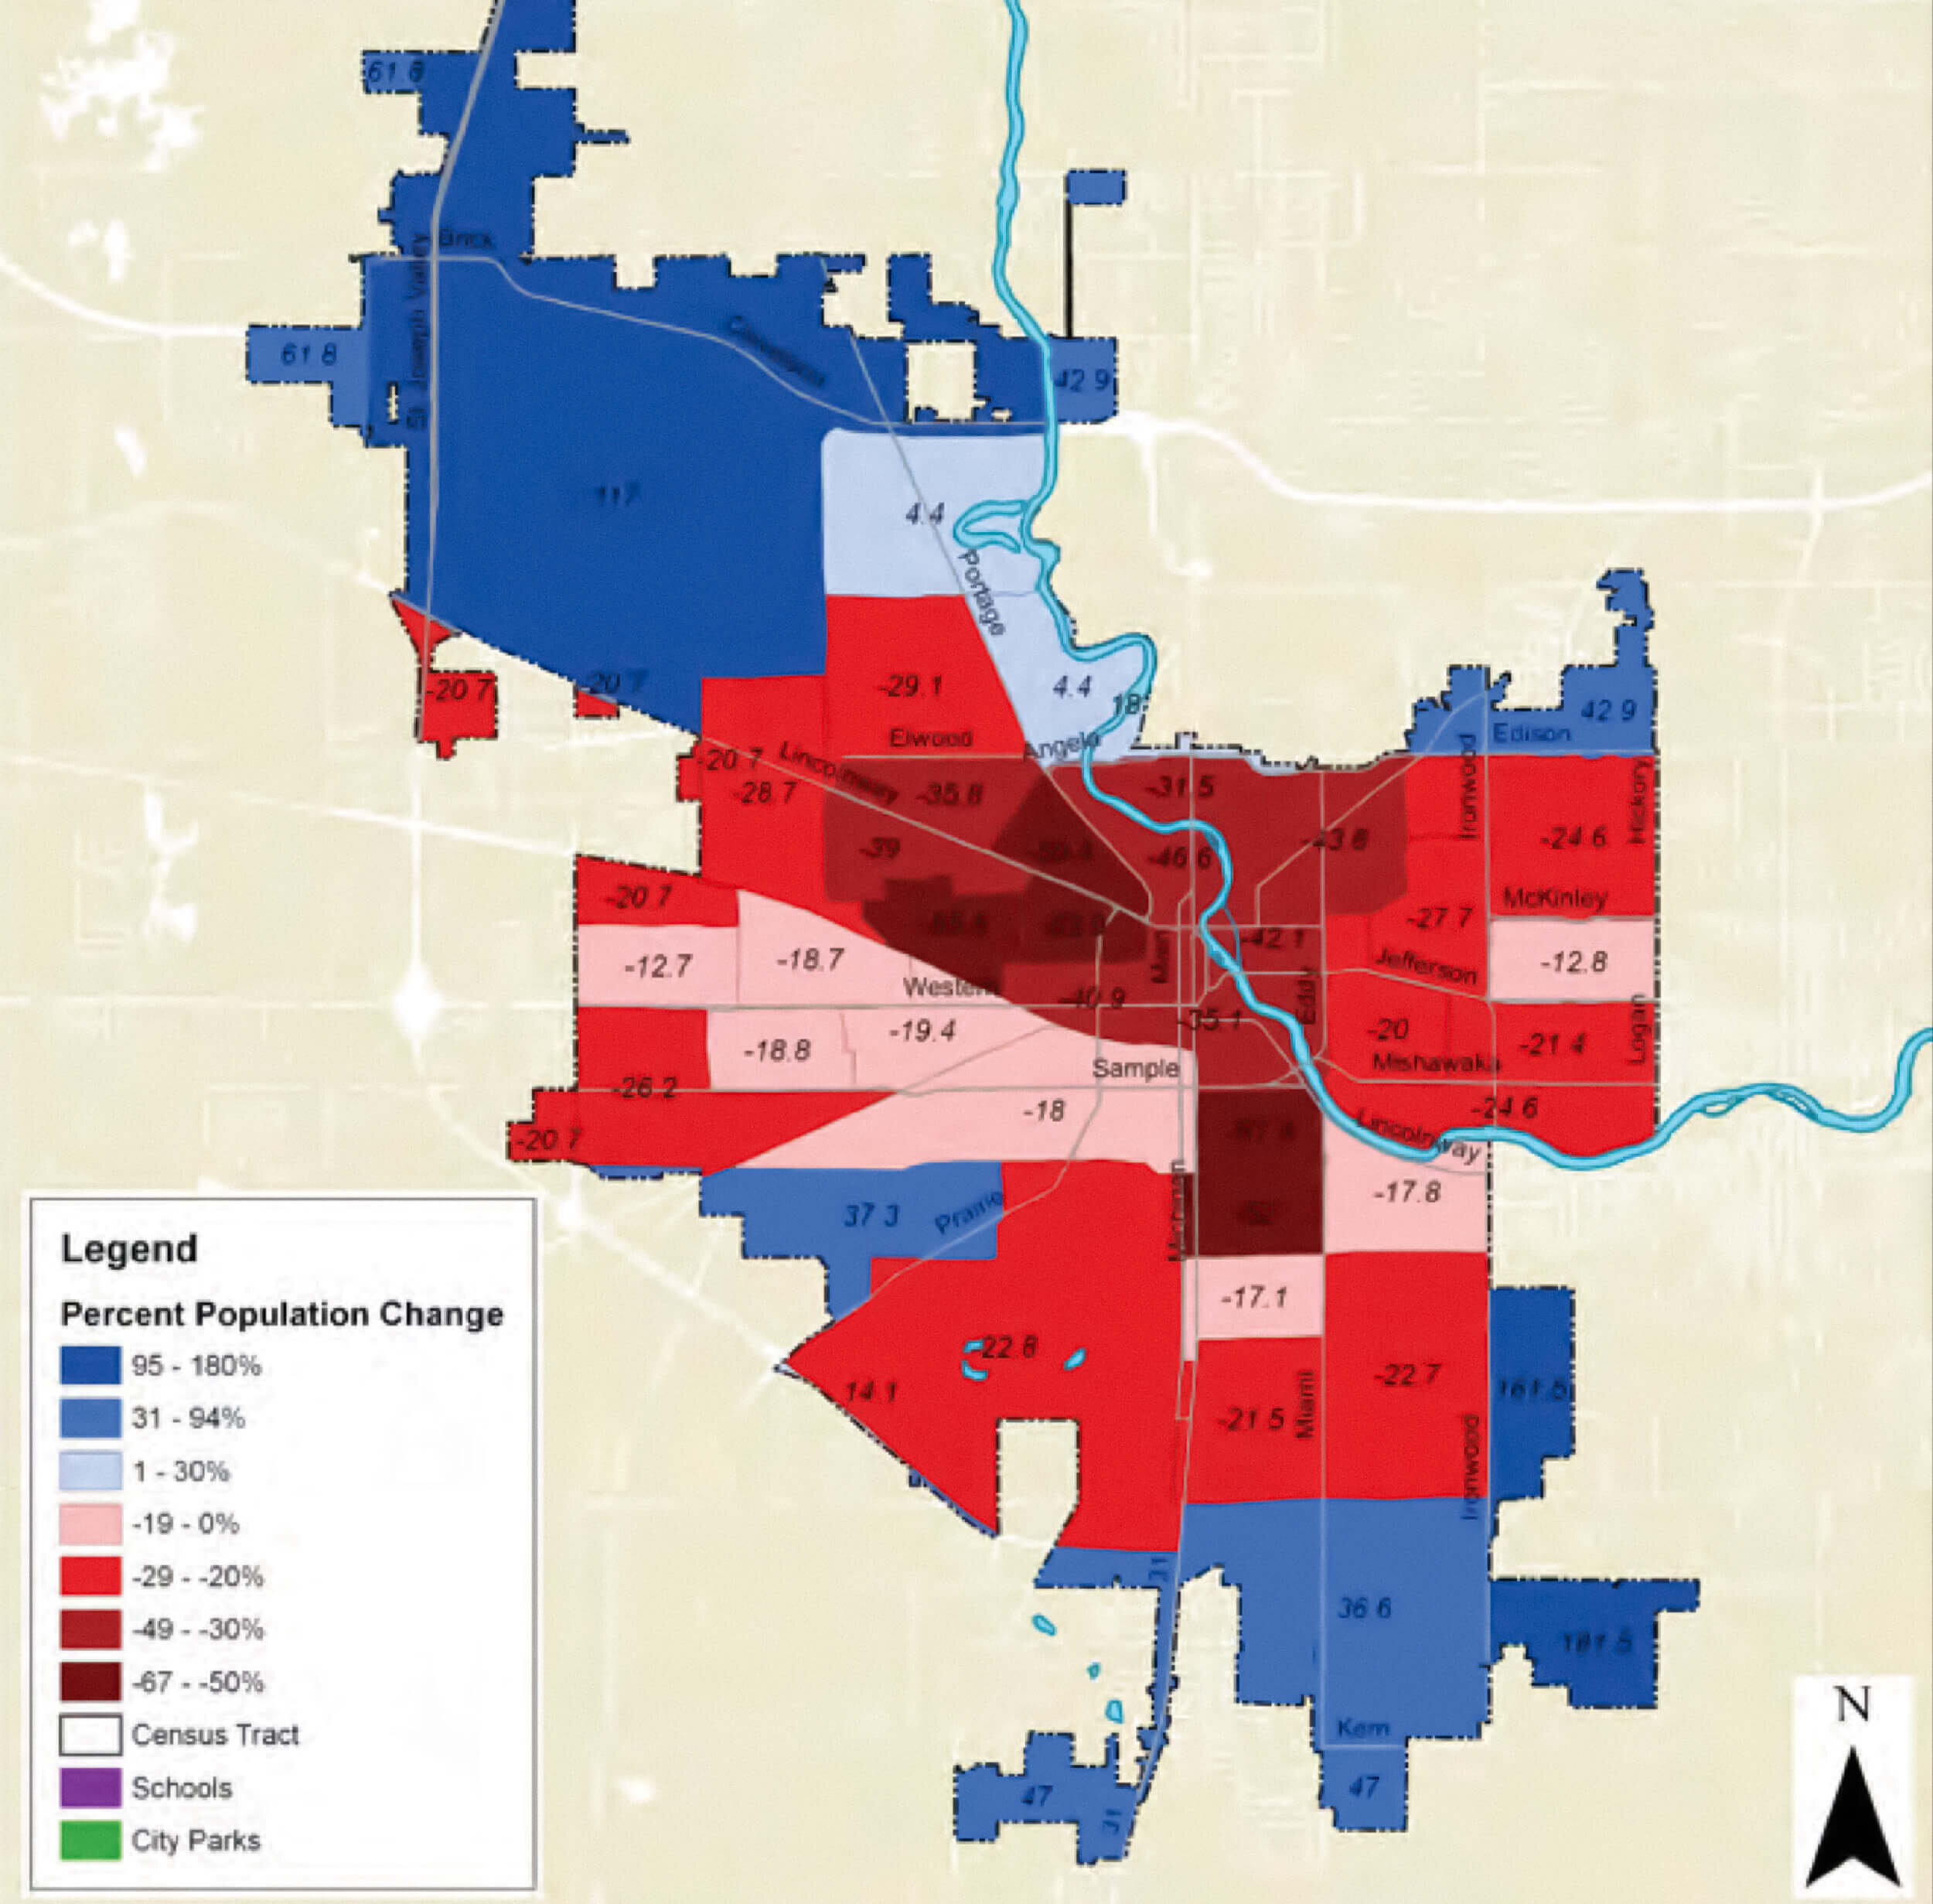
South Bend Vacant and Abandoned Properties Task Force Report 2013 showing percentage decline from 1970 - 2010
The map above was created by South Bend’s Vacant and Abandoned Properties Task Force Report from 2013. Let’s ignore the areas in blue for now, most of which were not incorporated in 1960. Another article in the series will discuss the annexation of these areas and their effects, both positive and negative, on the city.
An easy way to think about how deep the collapse of our population was is to realize that those areas shaded in varying degrees of red contained about 132,000 people in 1960. Today, the entire city, including all the areas in blue which were annexed over the past 50 years, contain about 102,000 people. This means that the population drop is even more pronounced than at first glimpse. The 2010 population of the area within the 1960 South Bend city limits was about 86,000, a loss of 46,370 or 35% from that peak.¹
Again, think about that and don’t just write it off as something that was always going to happen. If we time traveled back to 1960 South Bend and told people the city as they knew it would lose nearly 50,000 people in five decades, they would not have believed you. It would be completely against what they had experienced in the previous twelve decades of their city’s history.
This article will focus on how we got to those crazy numbers. It wasn’t just the West Side. It’s not just the neighborhoods today where the collapse in population is so evident it can’t be ignored after you walk down a block with one occupied home. Numbers that large indicate that all areas of the 1960 city lost population. When looking at the numbers, there are three rough versions of population loss for existing 1960 South Bend neighborhoods.
The three types of decline are: 1. Shrinking household size neighborhoods 2. Shrinking housing unit neighborhoods 3. Freefall neighborhoods.
Type 1: Shrinking household size neighborhoods
While some census tracts on the West Side lost a staggering 60% of their populations, all tracts on South Bend’s east side have lost population since 1960 as well. River Park tracts lost over 20% of their population, Sunnymede lost 20%, and Edison Park lost nearly 25%.
Take a walk through Sunnymede, River Park, or Edison Park today and you would not know that these neighborhoods have lost a quarter of their peak populations. There are few, if any, vacant lots or abandoned houses, the lawns are well kept, and the lights come on at night. We will call this the first type of neighborhood population decline. So how did these neighborhoods – and other ones like the then suburban fringe neighborhoods like Twyckenham Hills or Miami Hills – lose around 20-25% of their population without the typical experience of vacant homes that we associate with population loss?
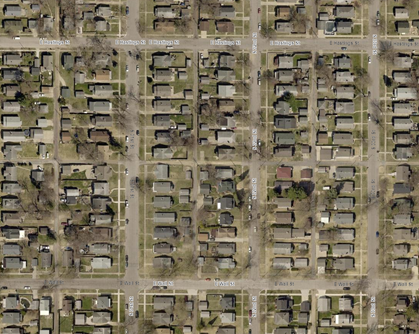
A typical section of the River Park neighborhood. No vacant lots shown here.
One discovers a simple answer: shrinking household size. Household size is simply the number of people living in one housing unit. A couple with one child has a household size of three. In 1960, South Bend’s average household size was 3.24, but by 2010 that figure has dropped to 2.54. This change in household size alone accounts for a large chunk of our overall population loss and this is how many neighborhoods considered stable still lose population.
Let’s take Sunnymede, represented by Census Tract 16, as an example. In 1970, the population was 2,905 among 950 households. The household average size was 3.06. By 2010, the population had shrunk to 2,323 people in 912 households, or an average household size of 2.55. While the census tract did lose 4% of its households – this may be from slight changes of the tract limits and vacancies – the tract lost 20% of its population. This isn’t the traditional type of population loss we think of, but it is vital in understanding what happened to South Bend.
Let’s see what this would look like in a hypothetical scenario. A soldier comes home from World War II and marries his childhood sweetheart in 1947. They buy a new home in Sunnymede in 1949. Both husband and wife were already from South Bend, so they do not represent population growth in the 1950 census, but they are considered a new household. During the 1950s, they have three children, just like thousands of other families in South Bend participating in generating the Baby Boom Generation. In the 1960 census, the household is now five people and the household population has grown 150% as far as the city is concerned.
During the 1960s, the oldest child goes off to Vietnam and the middle child goes downstate to attend Indiana University in Bloomington. When the 1970 census occurs, the household drops to only three people, a loss of 40% for the city. During the 1970s, the youngest marries and moves to the new homes built in unincorporated Clay Township, and the other two children never move back to the area. By 1980, the population for the household is once again two people, which is a 33% loss from the previous census. The husband dies of old age in the late 1980s and in the 1990 census, the household is now one person. Another 50% loss for the household.
This is a large reason South Bend lost so much population between the years 1960 and 1990. From outside, the house and its effect on the neighborhood look very similar. While the activity level is down without the kids and husband, the wife keeps up the home. After all, it is one of her prime assets since the mortgage has long been paid off. From the view of the city, however, that small one house section of Sunnymede has lost 50% of its 1950 population and 80% of its 1960 population.
Continuing our scenario, suppose that in the 1990s the wife is convinced by her grown children that it’s time for her to move to a nursing home or one of their own homes. A new couple buys the home and the process starts over again. However, this couple only has two children. In the 2010 census, the house is back to four people, which is relative growth, but still 20% below the count of 1960.
This is what the population decline looks like in stable neighborhoods that have maintained a functioning housing market. However, the likelihood of all the Sunnymede houses being replaced with large nuclear families is very low. Many of these homes are occupied by single people, couples both older and younger, or families with one child or other types of arrangements that will probably never reach the height of five people in the home. Families are simply smaller now across the country. Sunnymede – and really all our pre-1960 neighborhoods – were built for a world expecting that the vast majority of households would be families with two adults and 2-4 children. That world no longer exists, and it hasn’t for a while. These neighborhoods had clear demand for people to live in them - and still do - but they did not add (and even lost some) housing units.
Neighborhoods like Sunnymede with stable housing markets should have been bulwarks against falling population during the latter part of the 20th Century. However, the City froze these largely white neighborhoods in single family zoning districts which prevented any additional units being created in the neighborhoods. These were desirable places to live but once the neighborhood was fully built out, the population could only go down. A city’s most desirable areas should be allowed to grow and develop, not frozen in amber.
By multiplying this effect across all the neighborhoods in the city, South Bend would easily have a 20% population decline from the height of the 1960s. The only way the city could have combatted this population decline in the neighborhoods was to densify, which was not an option. Single family zoning became the norm in nearly all the stable neighborhoods across the city. The thinking of the time was that any densification be it even allowing for such things as duplexes or fourplexes could lead to property values declining and a change in neighborhood character. This limitation made population decline nearly impossible to avoid. The lack of solutions for these desirable neighborhoods to increase their density will be a question later examined as well.
With no way to further add residents to stable neighborhoods, the only remaining option to stabilize the city’s populations was to annex as much land as possible and build new suburban style homes. To an extent the city did do this, especially extending further to the south. Jack Cowell, in a 1971 South Bend Tribune article, identifies that growth in Centre and German Townships helped stem some of the bleeding from Portage Township.²
But it wasn’t enough. By the 1970 census, people aged 20-34 were declining in large numbers. As young adults went to college, war, or the workforce, they found a way out of the South Bend city limits and never returned. This phenomenon is historically referred to as White Flight. As the first generation after World War II came of age, many left the region entirely, and the ones who did stay left the city limits for supposed greener suburban pastures. Their parents often remained.
In order to once against reach the population peak of the 1960s, the city will need to build a lot more housing units to make up for the fact most neighborhoods won’t hold the same amount of people as they once did. While these neighborhoods don’t look like they have lost a fifth of their population, but they certainly have and this loss resulted in real consequences for South Bend and its residents.
Type 2: Shrinking housing units neighborhood
The second type of decline is best reflected by certain neighborhoods on the southwest and southeast sides of South Bend. For example, Census Tract 27, which lies just south of Pulaski Park and around St. Casimir Church. It lost 19% of its population since 1960. While this figure is somewhat surprisingly less than the East Side neighborhoods mentioned above, this area arrived at it in a very different way.
In 1970, Census Tract 27 had 2,350 people and 767 households, for an average household size of 3.06. By 2010, the tract had 1,926 people with 325 households and an average household size of 5.93. (This tract may have skewed numbers due to the fact that the County Jail being located within its borders.) The trend is still clear. The tract lost a large number of households, but the average household size grew dramatically. This area is now one of our neighborhoods with a large Hispanic/Latinx population. Hispanic household sizes have been higher than South Bend’s average household size for decades, although the two are converging with each decade.
This is an example of a neighborhood witnessing a different type of decline. While some housing units are not maintained and torn down, the neighborhood is stable enough that new families still decide to move in. We will explore farther below why housing units are demolished. The loss of housing units is offset by increases in household size, keeping the neighborhood’s population relatively steady. Census tracts that border Western Avenue, and a few in the south east, have similar patterns.
Scattered vacant lots dot the neighborhood just west of Pulaski Park.
Type 3: Freefall neighborhoods
Now consider the last type of neighborhood decline, the one that often comes to mind when thinking about population decline: the image of half or more of the lots on a block vacant, with a few well-kept homes remaining.
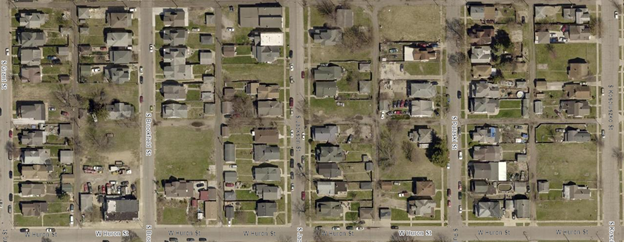
For this example, we will look at Census Tract 19, which consists of the Near West Side neighborhood north of Washington Street and south of Lincoln Way West. In 1970, this tract had just over 3,000 people. In 2010, its population plummeted to 1,115, a loss of 64%. This has been one of the hardest hit areas in the City of South Bend. The aerial photograph below is the neighborhood just north of City Cemetery and it is these images are what most people are familiar with when they think of South Bend’s population decline.
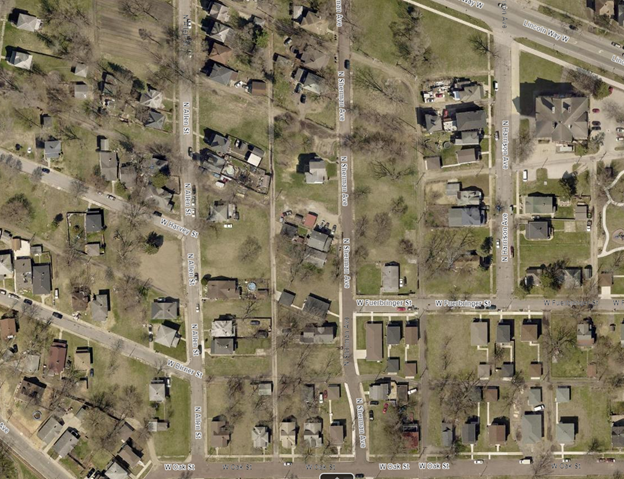
Vacant lots nearly outnumber houses in the Near West Neighborhood just north of City Cemetery.
Why did this happen? This question will be explored in another article, but we can reach some obvious conclusions here. In 1970, there were 1,251 households in Tract 19. By 2010, that number plummeted to 484, and its population per household also declined from 2.47 to 2.3 during the same time period. This is a neighborhood that has been in freefall for the last five decades. We will see in the 2020 census if the freefall has finally stopped, slowed down, or accelerated.
Neighborhoods such as these are like the candle being burned from two ends: declining numbers of households and the households that remain are smaller. It’s a recipe for neighborhood collapse. However, to the more than one thousand people who live here, their homes, lives, and neighborhood still very much matter. It is the onus of the entire City of South Bend – both its government and its people – to do what is possible to repair these neighborhoods and provide the same access to quality services as any other neighborhood in the city.
Unfortunately, that has not always been the case in practice. We also cannot ignore the factor of race was undoubtedly cause for a good deal of this collapse. It is no secret that this neighborhood. and others that suffered similar fates, are largely occupied by African Americans. In the following article that analyzes why these neighborhoods suffered the way they did, race will be a significant factor.
Let’s play with another hypothetical scenario. As in the story above with Sunnymede, let’s begin just after World War II. A returning African American serviceman comes home and he too marries his high school sweetheart. However, since he is Black, he does not have access to Veterans Affairs Loans like his white counterpart above. He is also barred from moving to a new home in Sunnymede because that neighborhood has restrictive covenants denying an African American (as well Jewish and certain types of Catholics) from buying a home.³
Since he has limited access to acquire loans and is denied the ability to live in some of the newer neighborhoods, he and his wife purchase an older home built in 1918 just north of City Cemetery. He and his wife have two children and the neighborhood population grows until the 1960s. Both of his children go to Vietnam and, in the 1970 census, the population of the house drops to two. So far, this is similar to the Sunnymede story. Here is where it differs. By the 1970s, the husband and wife have both acquired stable, well-paying jobs. With some of the structural barriers to moving gone, the couple decides to purchase a new home on the south side of the city near the developing Scottsdale Mall.
The person who purchases their old home rents the property out first to a family of three, slightly boosting the population. Over the next two decades, a succession of families rent the residence, but the landlord, who does not live in the neighborhood, puts in only the bare minimum of upkeep. The landlord then sells the property in the early 2000s to another individual who does even less than the bare minimum. By now the property is only valued around $20,000, too low for any bank to consider a mortgage for the property, and only people who can pay with cash are able to purchase the property. They stop paying taxes and maintaining the structure, but still rent to people with no other choices, trying to squeeze as much money out of the property as possible. As a poorly maintained house in a “bad neighborhood,” the house is unlikely to sell at tax sale, allowing the landlord to continue renting until the City condemns the property. The housing bubble bursts in the late 2000s and the property is now valued at less than $10,000. In the 2010s, the property – which has been on the tax sale for years and has multiple code violations on it – is demolished by the City.
This is a hypothetical, clear cut story. Nothing in the real world is ever quite as simple, but the theme of the story is accurate in how a neighborhood can lose two-thirds of its population in only four decades. There are multiple factors contributing to why some neighborhoods staved off this fate and many others did not.
While I have laid out three versions of population decline for the neighborhoods that existed in 1960 South Bend, no two neighborhoods are the same. Each neighborhood in South Bend has its own story of what happened and what is still happening, at times blending the three types of decline mentioned above.
I hope this article has demonstrated that population decline can be found in nearly all older neighborhoods within the City of South Bend. It’s easy to think that the solution is to build more houses in our neighborhoods hardest hit by population loss, but even so, neighborhoods like Sunnymede will also never recover to their 1960 height unless policy changes promote more housing units in our stable neighborhoods. That needs to be factored into any thinking on how South Bend can grow our population once again.
Next, we will really dig into the why of all these neighborhoods. Why did this population decline occur when nothing like it had happened before? We will examine White Flight and Changing Housing Desires / Racial Structures Limiting Growth / Decline in Manufacturing / Harmful Urban Planning and Zoning Effects.